International Journal of Mobile and Blended Learning (IJMBL)
Editor-in-Chief: David Parsons (The Mind Lab by Unitec, New Zealand)
Published Quarterly. Est. 2009.
ISSN: 1941-8647|EISSN: 1941-8655|DOI: 10.4018/IJMBL
Description
The International Journal of Mobile and Blended Learning (IJMBL) provides a forum for researchers in this field to share their knowledge and experience of combining e-learning and m-learning with other educational resources. Providing researchers, practitioners, and academicians with insight into a wide range of topics such as knowledge sharing, mobile games for learning, collaborative learning, and e-learning, this journal contains useful articles for those seeking to learn, analyze, improve, and apply technologies in mobile and blended learning. The journal spans theoretical, technical, and pedagogical issues in mobile and blended learning. These embrace comprehensive or critical reviews of the current literature, relevant technologies and applications, and important contextual issues such as privacy, security, adaptivity, and resource constraints.
Topics Covered
- Comprehensive or critical reviews of the current literature
- Evaluation of mobile or blended learning in practice
- Future of mobile or blended learning
- Knowledge Sharing
- Learner interaction/collaborative learning
- Mobile games for learning
- Mobile or blended learning applications
- Mobile or blended learning applied at different levels of education from pre-school to tertiary and beyond
- Pedagogical and/or philosophical underpinnings of mobile or blended learning
- Privacy and security issues
- Related research in learning, including e-learning and pedagogical approaches
- Resource constraints in the delivery of mobile or blended learning
- Reviews of the application of mobile or blended learning in multiple contexts
- Role of Wikis, blogs, podcasts, messaging, other online tools, and Web 2.0 components in learning delivery
- Roles of mobile, pervasive, and immersive technologies in education
- Technologies that directly or indirectly support mobile or blended learning systems (devices, networks, tools etc.)
- Theoretical approaches to mobile or blended learning solutions
- Use of mobile or blended learning in professional environments
Mission
The primary mission of the International Journal of Mobile and Blended Learning (IJMBL) is to provide comprehensive coverage and understanding of the role of innovative learning theory and practice in an increasingly mobile and pervasive technological environment. As technology enables a more seamless experience of device supported learning worlds that may integrate mobile, embedded, augmented, and immersive technologies, we may expect to see increasing interest and activity in blended approaches to learning. IJMBL brings together researchers at the forefront of this field, in both technology and pedagogical practice and assists them in the development and dissemination of new approaches to both mobile and blended learning.
+++++++++++++++++++++
More on mobile and blended learning in this IMS blog:
https://blog.stcloudstate.edu/ims?s=mobile+learning
https://blog.stcloudstate.edu/ims?s=blended+learning
Boulder Faculty Teaching with Technology Report
Sarah Wise, Education Researcher , Megan Meyer, Research Assistant, March 8,2016
http://www.colorado.edu/assett/sites/default/files/attached-files/final-fac-survey-full-report.pdf
Faculty perceive undergraduates to be less proficient with digital literacy skills. One-third think
their students do not find or organize digital information very well. The majority (52%) think
they lack skill in validating digital information.
My note: for the SCSU librarians, digital literacy is fancy word for information literacy. Digital literacy, as used in this report is much greater area, which encompasses much broader set of skills
Faculty do not prefer to teach online (57%) or in a hybrid format (where some sessions occur
online, 32%). One-third of faculty reported no experience with these least popular course types
my note: pay attention to the questions asked; questions I am asking Mike Penrod to let me work with faculty for years. Questions, which are snubbed by CETL and a dominance of D2L and MnSCU mandated tools is established.
Table 5. Do you use these in-class technologies for teaching undergraduates? Which are the Top 3 in-class technologies you would like to learn or use more? (n = 442)
|
Top 3 |
use in most of my classes |
have used in some classes |
tried, but do not use |
N/A: no experience |
| in-class activities, problems (via worksheets, tablets, laptops, simulations, beSocratic, etc.) |
52% |
33% |
30% |
6% |
30% |
| in-class question, discussion tools (e.g. Twitter, TodaysMeet, aka “backchannel communication”) |
47% |
8% |
13% |
11% |
68% |
| using online resources to find high quality curricular materials |
37% |
48% |
31% |
3% |
18% |
| iClickers |
24% |
23% |
16% |
9% |
52% |
| other presentation tool (Prezi, Google presentation, Slide Carnival, etc.) |
23% |
14% |
21% |
15% |
51% |
| whiteboard / blackboard |
20% |
58% |
23% |
6% |
14% |
| Powerpoint or Keynote |
20% |
74% |
16% |
4% |
5% |
| document camera / overhead projector |
15% |
28% |
20% |
14% |
38%
|
Table 6. Do you have undergraduates use these assignment technology tools? Which are your Top 3 assignment technology tools to learn about or use more? (n = 432)
|
Top 3 |
use in most of my classes |
have used in some classes |
tried, but do not use |
N/A: no experience using |
| collaborative reading and discussion tools (e.g. VoiceThread, NB, NotaBene, Highlighter, beSocratic) |
43% |
3% |
10% |
10% |
77% |
| collaborative project, writing, editing tools (wikis, PBWorks, Weebly, Google Drive, Dropbox, Zotero) |
38% |
16% |
29% |
12% |
43% |
| online practice problems / quizzes with instant feedback |
36% |
22% |
22% |
8% |
47% |
| online discussions (D2L, Today’s Meet, etc) |
31% |
33% |
21% |
15% |
30% |
| individual written assignment, presentation and project tools (blogs, assignment submission, Powerpoint, Prezi, Adobe Creative Suite, etc.) |
31% |
43% |
28% |
7% |
22% |
| research tools (Chinook, pubMed, Google Scholar, Mendeley, Zotero, Evernote) |
30% |
33% |
32% |
8% |
27% |
| online practice (problems, quizzes, simulations, games, CAPA, Pearson Mastering, etc.) |
27% |
20% |
21% |
7% |
52% |
| data analysis tools (SPSS, R, Latex, Excel, NVivo, MATLAB, etc.) |
24% |
9% |
23% |
6% |
62% |
| readings (online textbooks, articles, e-books) |
21% |
68% |
23% |
1% |
8% |
Table 7. Do you use any of these online tools in your teaching? Which are the Top 3 online tools you would like to learn about or use more? (n = 437)
|
Top 3 |
use in most of my classes |
have used in some classes |
tried, but do not use |
N/A: no experience using |
| videos/animations produced for my course (online lectures, Lecture Capture, Camtasia, Vimeo) |
38% |
14% |
21% |
11% |
54% |
| chat-based office hours or meetings (D2L chat, Google Hangouts, texting, tutoring portals, etc.) |
36% |
4% |
9% |
10% |
76% |
| simulations, PhET, educational games |
27% |
7% |
17% |
6% |
70% |
| videoconferencing-based office hours or meetings (Zoom, Skype, Continuing Education’s Composition hub, etc.) |
26% |
4% |
13% |
11% |
72% |
| alternative to D2L (moodle, Google Site, wordpress course website) |
23% |
11% |
10% |
13% |
66% |
| D2L course platform |
23% |
81% |
7% |
4% |
8% |
| online tutorials and trainings (OIT tutorials, Lynda.com videos) |
21% |
4% |
16% |
13% |
68% |
| D2L as a portal to other learning tools (homework websites, videos, simulations, Nota Bene/NB, Voice Thread, etc.) |
21% |
28% |
18% |
11% |
42% |
| videos/animations produced elsewhere |
19% |
40% |
36% |
2% |
22% |
In both large and small classes, the most common responses faculty make to digital distraction are to discuss why it is a problem and to limit or ban phones in class.
my note: which completely defies the BYOD and turns into empty talk / lip service.
Quite a number of other faculty (n = 18) reported putting the onus on themselves to plan engaging and busy class sessions to preclude distraction, for example:
“If my students are more interested in their laptops than my course material, I need to make my curriculum more interesting.”
I have not found this to be a problem. When the teaching and learning are both engaged/engaging, device problems tend to disappear.”
The most common complaint related to students and technology was their lack of common technological skills, including D2L and Google, and needing to take time to teach these skills in class (n = 14). Two commented that digital skills in today’s students were lower than in their students 10 years ago.
Table 9. Which of the following are the most effective types of learning opportunities about teaching, for you? Chose your Top 2-3. (n = 473)
Count Percentage
| meeting 1:1 with an expert |
296 |
63% |
| hour-long workshop |
240 |
51% |
| contact an expert on-call (phone, email, etc) |
155 |
33% |
| faculty learning community (meeting across asemester,
e.g. ASSETT’s Hybrid/Online Course Design Seminar) |
116 |
25% |
| expert hands-on support for course redesign (e.g. OIT’s Academic Design Team) |
114 |
24% |
| opportunity to apply for grant funding with expert support, for a project I design (e.g. ASSETT’s Development Awards) |
97 |
21% |
| half-day or day-long workshop |
98 |
21% |
| other |
40 |
8% |
| multi-day retreats / institutes |
30 |
6% |
Faculty indicated that the best times for them to attend teaching professional developments across the year are before and early semester, and summer. They were split among all options for meeting across one week, but preferred afternoon sessions to mornings. Only 8% of respondents (n = 40) indicated they would not likely attend any professional development session (Table 10).
+++++++++++++++++++++++++++
Teaching Through Technology
Table T1: Faculty beliefs about using digital technologies in teaching
|
Count |
Column N% |
| Technology is a significant barrier to teaching and learning. |
1 |
0.2% |
| Technology can have a place in teaching, but often detracts from teaching and learning. |
76 |
18.3% |
| Technology has a place in teaching, and usually enhances the teaching learning process. |
233 |
56.0% |
| Technology greatly enhances the teaching learning process. |
106 |
25.5% |
Table T2: Faculty beliefs about the impact of technology on courses
|
Count |
Column N% |
| Makes a more effective course |
302 |
72.6% |
| Makes no difference in the effectiveness of a course |
42 |
10.1% |
| Makes a less effective course |
7 |
1.7% |
| Has an unknown impact |
65 |
15.6% |
Table T3: Faculty use of common technologies (most frequently selected categories shaded)
|
Once a month or less |
A few hours a month |
A few hours a week |
An hour a day |
Several hours a day |
| Count |
% |
Count |
% |
Count |
% |
Count |
% |
Count |
% |
| Computer |
19 |
4.8% |
15 |
3.8% |
46 |
11.5% |
37 |
9.3% |
282 |
70.7% |
| Smart Phone |
220 |
60.6% |
42 |
11.6% |
32 |
8.8% |
45 |
12.4% |
24 |
6.6% |
| Office Software |
31 |
7.8% |
19 |
4.8% |
41 |
10.3% |
82 |
20.6% |
226 |
56.6% |
| Email |
1 |
0.2% |
19 |
4.6% |
53 |
12.8% |
98 |
23.7% |
243 |
58.7% |
| Social Networking |
243 |
68.8% |
40 |
11.3% |
40 |
11.3% |
23 |
6.5% |
7 |
2.0% |
| Video/Sound Media |
105 |
27.6% |
96 |
25.2% |
95 |
24.9% |
53 |
13.9% |
32 |
8.4% |
Table T9: One sample t-test for influence of technology on approaches to grading and assessment
|
Test Value = 50 |
| t |
df |
Sig. (2-tailed) |
Mean Difference |
95% Confidence Interval of the Difference |
| Lower |
Upper |
| In class tests and quizzes |
-4.369 |
78 |
.000 |
-9.74684 |
-14.1886 |
-5.3051 |
| Online tests and quizzes |
5.624 |
69 |
.000 |
14.77143 |
9.5313 |
20.0115 |
| Ungraded assessments |
1.176 |
66 |
.244 |
2.17910 |
-1.5208 |
5.8790 |
| Formative assessment |
5.534 |
70 |
.000 |
9.56338 |
6.1169 |
13.0099 |
| Short essays, papers, lab reports, etc. |
2.876 |
70 |
.005 |
5.45070 |
1.6702 |
9.2312 |
| Extended essays and major projects or performances |
1.931 |
69 |
.058 |
3.67143 |
-.1219 |
7.4648 |
| Collaborative learning projects |
.000 |
73 |
1.000 |
.00000 |
-4.9819 |
4.9819 |
Table T10: Rate the degree to which your role as a faculty member and teacher has changed as a result of increased as a result of increased use of technology
|
Strongly Disagree |
Disagree |
Somewhat Disagree |
Somewhat Agree |
Agree |
Strongly Agree |
| Count |
% |
Count |
% |
Count |
% |
Count |
% |
Count |
% |
Count |
% |
| shifting from the role of content expert to one of learning facilitator |
12 |
9.2% |
22 |
16.9% |
14 |
10.8% |
37 |
28.5% |
29 |
22.3% |
16 |
12.3% |
| your primary role is to provide content for students |
14 |
10.9% |
13 |
10.1% |
28 |
21.7% |
29 |
22.5% |
25 |
19.4% |
20 |
15.5% |
| your identification with your University is increased |
23 |
18.3% |
26 |
20.6% |
42 |
33.3% |
20 |
15.9% |
12 |
9.5% |
3 |
2.4% |
| you have less ownership of your course content |
26 |
20.2% |
39 |
30.2% |
24 |
18.6% |
21 |
16.3% |
14 |
10.9% |
5 |
3.9% |
| your role as a teacher is strengthened |
13 |
10.1% |
12 |
9.3% |
26 |
20.2% |
37 |
28.7% |
29 |
22.5% |
12 |
9.3% |
| your overall control over your course(s) is diminished |
23 |
17.7% |
44 |
33.8% |
30 |
23.1% |
20 |
15.4% |
7 |
5.4% |
6 |
4.6% |
Table T14: One sample t-test for influence of technology on faculty time spent on specific teaching activities
|
|
Test Value = 50 |
| t |
df |
Sig. (2-tailed) |
Mean Difference |
95% Confidence Interval of the Difference |
| Lower |
Upper |
| Lecturing |
-7.381 |
88 |
.000 |
-12.04494 |
-15.2879 |
-8.8020 |
| Preparing course materials |
9.246 |
96 |
.000 |
16.85567 |
13.2370 |
20.4744 |
| Identifying course materials |
8.111 |
85 |
.000 |
13.80233 |
10.4191 |
17.1856 |
| Grading / assessing |
5.221 |
87 |
.000 |
10.48864 |
6.4959 |
14.4813 |
| Course design |
12.962 |
94 |
.000 |
21.55789 |
18.2558 |
24.8600 |
| Increasing access to materials for all types of learners |
8.632 |
86 |
.000 |
16.12644 |
12.4126 |
19.8403 |
| Reading student discussion posts |
10.102 |
79 |
.000 |
21.98750 |
17.6553 |
26.3197 |
| Email to/with students |
15.809 |
93 |
.000 |
26.62766 |
23.2830 |
29.9724 |
++++++++++++++++++++++++++
Study of Faculty and Information Technology, 2014
http://net.educause.edu/ir/library/pdf/ers1407/ers1407.pdf
Although the LMS is pervasive in higher education, 15% of faculty said that they
do not use the LMS at all. Survey demographics suggest these nonusers are part of
the more mature faculty ranks, with a tenure status, more than 10 years of teaching
experience, and a full-professor standing.
18
The vast majority of faculty use the LMS
to conduct or support their teaching activities, but only three in five LMS users (60%)
said it is critical to their teaching. The ways in which faculty typically use the LMS are
presented in figure 8.
19
Pushing out information such as a syllabus or other handout
is the most common use of the LMS (58%), which is a basic functionality of the
first-generation systems that emerged in the late 1990s, and it remains one of the core
features of any LMS.
20
Many institutions preload the LMS with basic course content
(58%), up about 12% since 2011, and this base gives instructors a prepopulated plat
–
form from which to build their courses.
21
Preloading basic content does not appear to
preclude faculty from making the LMS part of their daily digital habit; a small majority
of faculty (56%) reported using the LMS daily, and another 37% use it weekly.
+++++++++++++++++++++++++++++
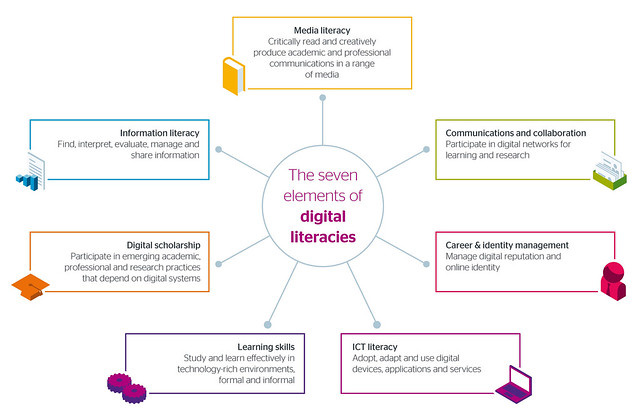
Digital Literacy, Engagement, and Digital Identity Development
https://www.insidehighered.com/blogs/student-affairs-and-technology/digital-literacy-engagement-and-digital-identity-development
+++++++++++++++++
++++++++++++++++
more on digital literacy in this IMS blog
https://blog.stcloudstate.edu/ims?s=digital+literacy
Save
Strategic Planning for Social Media in Libraries (2012)
Sarah K. Steiner
https://books.google.com/books/about/Strategic_Planning_for_Social_Media_in_L.html
http://www.alastore.ala.org/pdf/steiner_ch1.pdf
p. 1 definition of social media for libraries
six primarytypes exist: “collaborative projects, blogs, content communities, social networking sites,” and two types of virtual worlds: “virtual game worlds, which ask users to follow the rules of the game, and virtual social worlds, wherein users can behave without rules in almost any way they like” (Kaplan and Haenlein, 2010: 59)
it is not that I disagree with such definition, but i wish there was a “door” mentioning “flexibility” and “necessity to reassess” what social media is every year, 3 year, 5 years
p. 2 definition what is strategic planning
- identify the needs of your target audiences,
- identify the ways in which you can meet those needs, and
- identify ways to respond confidently and proactively to changesin those needs.
- Where the organization is
- Where the organization should go
- How the organization can get there (McNamara, 2011)
It must be:
- Flexible
- Based on data
- Maintainable
- Regularly cared for
covers and confirms my notes to the SCSU library use of its social media:
p. 83 ask uncomfortable questions
in planning, we must be prepared to ask, critically consider and answer questions that make us uncomfortable (not only that I was not let to ask questions, I was ousted from any body that was making decisions regarding social media. I was openly opposed and rebuked for asking why 3 reference librarians will keep the passwords to the account for the library SM)
p. 83 Communicate
If your team communicates honestly and thoroughly, then positive feelings and advocates for your social media endeavors will grow. In the span of 6 months, I had to ask three times where are the notes of the social media committee kept and eventually i will receive an answer, which in it nebulous and apologetic form was practically not an answer.
p. 83 Don’t rush to conclusions
Satisficing often works, but it can also lead to conclusions that are less then optimal.
In the fall of 2013, I had to fight an overwhelming majority opposing my proposal that social media needs to include student representation, since SM is about dialog, not broadcasting (see page 86) and the current staff and faculty see SM as another form of broadcasting. In the span of six months, by the summer of 2014 library staff and faculty had fallen in the other extreme, letting one single student run all library SM. That student did/could not have understanding of the scope and goals of the library resulting in satisficing.
p. 84 aim for consensus, but don’t require it
Consensus was the leitmotiv of the dean; it failed in general, and it failed in SM.
p. 84 get an external reviewer
p. 84 value and celebrate small success
a strategic plan will be realized through a series of small actions, not one or two pivotal plots.
p. 84 create accountability
p. 86 maintain a consistent tone and brand
visual and tone based consistency.
This library DOES maintain consistency by posting Instagram pictures of people covering their faces with books, so part of their face compliments a face on cover of books. It is done by other libraries and it would have been cute and original if not overdone. If the SM activities of a library consist mostly of such activities then the “branding” part definitely is hurt. Yet, the faculty in this library vehemently adhere to “let’s see what other libraries are doing,” but does not understand that it needs further conceptualizing to figure out how to transform into “brand.”
p. 86 capitalize on the strengths of social media
“in many cases, business and libraries use SM exactly as they use their websites: to push content.
This has been the main criticism from the start: the three reference librarians holding the passwords to the SM account were using Facebook as a announcement board and kept dormant the other accounts. The resolution of the library faculty who was called to arbitrate the argument with these three librarian: “I don’t understand very well Facebook.” The interim dean, who, subsequently had to resolve this dispute: “I don’t use Facebook.”
p. 87 Metrics
Analyze and tweak plan
measuring success is about maximizing time and efforts, not about laying blame for shortcomings or failures.
this applies to daily tasks and responsibilities and shuffling time, but when the organization does not have a clear overarching goal and clear strategy how to achieve it, then issues must be raised up. which leads to:
p. 92 Plan for conversation
the inclusion of conversation. incorporate your patrons as primary content creators (not appointing just a single student worker to broadcast)
p. 92 use SM as an assessment or feedback tool
p. 93 plan to monitor your brand
if you decide to start watching these types of mentions, you’ll want to consider whether you’ll adopt a passive or an active role in responding to them.
review:
http://www.tandfonline.com/doi/abs/10.1080/1941126X.2012.732867
+++++++++++++++++++++++++
Social media strategy 2013-2014
National Library Australia
https://www.nla.gov.au/policy-and-planning/social-media-strategy-2013
——————————–
10 Social Media Marketing Tips for Libraries,Ellyssa Kroski — February 12, 2013
http://oedb.org/ilibrarian/10-social-media-marketing-tips-for-libraries/
————————————–
Social Media: Libraries Are Posting, but Is Anyone Listening?By Nancy Dowd on May 7, 2013
http://lj.libraryjournal.com/2013/05/marketing/social-media-libraries-are-posting-but-is-anyone-listening/
————————————–
Strategic Planning for Social Media in Libraries: The Case of Zimbabwe
http://www.igi-global.com/chapter/strategic-planning-for-social-media-in-libraries/127826
Global E-Learning Market in Steep Decline, Report Says
By Richard Chang
https://campustechnology.com/articles/2016/09/01/global-elearning-market-in-steep-decline.aspx
a recent report released by Ambient Insight Research, a Washington state-based market research firm.
Revenues for self-paced e-learning in 2016 are heavily concentrated in two countries — the United States and China. The growth rate in the U.S. is at -5.3 percent, representing a $4.9 billion drop in revenues by 2021, while in China, the rate is at -8.8 percent, representing a $1.9 billion drop by 2021. The e-learning market in China has deteriorated rapidly in just the last 18 months, the report said.
- Of the 122 countries tracked by Ambient Insight, 15 have growth rates for self-paced e-learning over 15 percent during the next five years. These countries are heavily concentrated in Asia and Africa, with the two outliers being Slovakia and Lithuania.
- Eleven of the top 15 growth countries will generate less than $20 million by 2021. Of the top 15, Slovakia and Lithuania are anticipated to generate the highest revenues for self-paced products by 2021, at $55.4 million and $36.5 million, respectively.
- The growth rates are negative in every region except Africa, where the growth is flat at 0.9 percent. The steepest declines are in Asia and Latin America at -11.7 percent and -10.8 percent, respectively. The economic meltdowns in Brazil and Venezuela are major inhibitors in Latin America.
- There are 77 countries with flat-to-negative growth rates. The countries with the lowest growth rates are Yemen (-18.7 percent), Brazil (-19.8 percent), Qatar (-23.5 percent) and Venezuela (-26.8 percent).
Self-paced e-learning products include online courses, managed education services, managed training, e-books and learning management systems, according to the report. The author does not consider mobile and game-based learning, which are growing, to be in the self-paced e-learning category.
The news on the self-paced e-learning industry is so bad, Ambient Insight will no longer publish commercial syndicated reports on the industry, the firm says on its website and in the report.
++++++++++++++++
more on elearning in this IMS blog
https://blog.stcloudstate.edu/ims?s=elearning
Utilizing Augmented Reality For Special Needs Learning
Utilizing Augmented Reality For Special Needs Learning
Augmented reality is a variation of virtual environments, but has a few added advantages for special needs learning. With virtual environments the user is completely immersed in a virtual world and cannot see the real environment around him or her. This may cause some confusion for special needs learners and can hinder learning. In contrast, augmented reality allows the user to see the real world with virtual objects superimposed upon or composited with the real world. This provides the greatest benefit as learners remain part of the world around them and learn easily.
++++++++++++++++++++++++++
more on the topic
Muñoz, Silvia Baldiris Navarro and Ramón, “Gremlings in My Mirror: An Inclusive AR-Enriched Videogame for Logical Math Skills Learning”, Advanced Learning Technologies (ICALT) 2014 IEEE 14th International Conference on, pp. 576-578, 2014.
New assignment this fall in Minnesota schools: deal with ‘Pokémon Go’
1. School administrator John Wetter took on an odd assignment over summer break at the request of one of his principals: Track down any PokéStops or gyms lurking on Hopkins school grounds. He asked game developer Niantic Labs to remove it from the game.
So far the game has only been blocked at sites such as the
United States Holocaust Memorial Museum in Washington, D.C.
2. Some educators are embracing the interest in “Pokémon Go” as a potential teaching tool. “Any time something becomes a big pop culture sensation, as a teacher I try to just kind of ride the coattails,”
At St. Paul’s Washington Technology Magnet School, educator Eric Gunderson made a spinoff of “Pokémon Go” that students can play on their district-issued iPads. He created it using an augmented reality app called Aurasma. He printed pictures of eggs on sheets of paper. Get the printed egg in view of the iPad’s camera, and an animated animal appears onscreen, a knockoff Pokémon.
The Minnesota Department of Education said it hasn’t gotten inquiries from school districts concerned about “Pokémon Go.” A spokesperson for the Osseo Area School District noted that students face many distractions. “Our leaders are very skilled in dealing with whatever the distraction of the day is,” the spokesperson wrote in an email.
An LMS to Support ‘Gameful’ Learning
Seeking to bring the qualities of well-designed games to pedagogical assessment, the University of Michigan created a learning management system that uses gaming elements such as competition, badges and unlocks to provide students with a personalized pathway through their courses.
By David Raths 08/24/16
https://campustechnology.com/articles/2016/08/24/an-lms-to-support-gameful-learning.aspx
UM School of Information and School of Education
a new type of learning management system called GradeCraft. GradeCraft borrows game elements such as badges and unlocks to govern students’ progress through a course. With unlocks, for example, you have to complete a task before moving to the next level.
Written in Ruby on Rails and hosted on Amazon Web Services, GradeCraft was created by a small team of students and faculty with additional software support from Ann Arbor-based developer Alfa Jango. Their work received support from UM’s Office of Digital Education and Innovation and the Office of the Provost. GradeCraft can work as a stand-alone platform or in conjunction with a traditional LMS via the LTI (Learning Tools Interoperability) protocol.
Here is how it works: Instructors create a course shell within GradeCraft (similar to the process with any LMS). Students use a tool called the “Grade Predictor” to plan a personalized pathway through the course, making predictions about both what they will do and how they will perform. When assignments are graded, predictions turn into progress; students are then nudged to revisit their semester plan, reassessing what work is available and how well they need to do to succeed overall. Students are able to independently choose an assessment pathway that matches their interests within the framework of learning objectives for the course.
++++++++++++++
more on LMS in this blog
https://blog.stcloudstate.edu/ims?s=gaming
more on gaming in this blog
https://blog.stcloudstate.edu/ims?s=lms
more on badges in this blog
https://blog.stcloudstate.edu/ims?s=badges