The Prospect project at UNC’s DIL
https://www.linkedin.com/pulse/prospect-project-uncs-dil-matthew-belskie-msis?trk=hp-feed-article-title-publish
Prospect is a WordPress plugin. In an overly wordy sentence, Prospect is a domain-agnostic framework for data visualization in support of the digital humanities.
The concept is a simple one. We take data, and we represent it with images. We all get that part of it. The importance of that kind of work relies on the fact that we are humans, and we understand visual structures better and with more fidelity than we do tables of data.
Digital humanities isn’t just limited to the humanities – the design concepts that guide that field are relevant to all domains. At that level what we’re really talking about is a digital literacy, and one that will be instrumental in many of the possible futures that exist for our students.
https://www.libraryjuiceacademy.com/moodle/login/index.php
Eva Dodsworth
Since the emergence of easily accessible dynamic online mapping tools, there has been a drastic increase in geographic interest and awareness. Whether for personal, social, professional or academic uses, people are using Geographic Information System (GIS) technology to communicate information in a map format. Whether it’s using Google Earth to study urban change, or creating Google Map Mashups to deliver library resources, more and more members of society are turning to mapping programs for their visualization needs. With so many using GIS technology in their daily lives, library staff are now more than ever assisting library clients with their mapping queries.
This course will introduce students to a variety of mapping tools and GIS technologies such Google Earth and the creation of dynamic KML files; ArcGIS Online and webmap publishing; Google Fusion Tables and geocoding; and GIS fundamentals with geospatial data creation. Students will be able to apply their GIS skills in their reference work, in digitization projects, in webpages, in library instruction, and more. Through hands-on exercises, pre-recorded demonstrations and lectures, students will receive a thorough overview of mapping resources that will enhance and expose their library’s resources.
http://www.lib.uwaterloo.ca/locations/umd/WeekOne_2014.wmv
http://www.placingliterature.com/map?modal=1
http://www.lib.uwaterloo.ca/locations/umd/WeekTwo.wmv
http://www.lib.uwaterloo.ca/locations/umd/WeekThree_Part_One.mov
http://www.lib.uwaterloo.ca/locations/umd/WeekThree_Part2.mov
http://www.lib.uwaterloo.ca/locations/umd/WeekFour.mov
– How to enable offline maps in your Google Maps app – http://www.huffingtonpost.com/map-happy/how-to-enable-offline-maps_b_6525832.html
– Huge news – Google Earth Pro, which used to cost the public $400 is now free! What does that mean for you? Extra features! You can import GIS files, tables, and export animated movie files! http://google-latlong.blogspot.com.es/2015/01/google-earth-pro-is-now-free.html
– Don’t live in Canada? Too bad! Google Maps plots best tobagonning hills in Canada!http://www.ctvnews.ca/canada/google-map-plots-canada-s-best-tobogganing-hills-1.2218207
– a map of 19 countries that were named after specific people – http://www.vox.com/2015/2/1/7954179/map-countries-pe
By Paul KerleyBBC News Magazine
http://www.bbc.com/news/magazine-30840318
Content for Week Two – February 9th – February 15th
Week Two:
Podcast includes:
- Citizen Mapping
- OpenStreetMap – crowdsourcing
more heads are better then one
NYPL geomapping volunteers.
http://www.openstreetmap.org/
citizen crime reporting app for NYPD http://www.nyc.gov/html/nypd/html/crime_mapping/nyc_crime_map_introduction.shtml
when the jet disappeared, crowdsourcing for parts on the satellite maps of the ocean
potholes map
maps of the threes. emerald bug in Mnpls
http://www.fuf.net/
how does foursquare and checkins in FB and Google +fit it
Podcast and Powerpoint can be accessed from:http://www.lib.uwaterloo.ca/locations/umd/JuicyLibrarianMaterial.html
Tutorials: Google Earth
Assignments:
1. Discussion question:
Discover some citizen mapping projects that you are interested in OR
Contribute your local knowledge to Google Map Maker AND Share with the class online
2. Google Earth Map
Please complete the tutorial and then create a map in Google Earth with the following components:
- A title
- A written introduction to your project
- At least five placemarks, embedded with html tags, and images, if possible.
- Imported KML file(s) file format by GEarth, but other apps is using it. using notepad or MS Word, one can create KML file.
screen overlay, can be text, image, anything. legend. HTML code.
- A screen overlay (i.e. a legend)
areal photography.
history.
images from the library, Google is willing to buy them. citizen mapping. scanning and uploading.
geographical and societal awareness.
Gallery: 360Cities.
google street view – historical views
Google Earth Mapping
Submit online as a KML/KMZ file
I had the opportunity to experience a gizmo that can be used to display a variety of mapping projects, including citizen mapping: Science on a Sphere. It is a sphere on which you can project static maps or animations. The one I saw, in the National Oceanic and Atmospheric Administration’s facility on Ford Island in Honolulu, displayed animations showing the 2004 Indian Ocean tsunami and the 2011 tsunami in Japan, as well as airline flight paths, ocean currents, polar ice cap change over time, and many other types of geospatial data.
The Great Backyard Bird Count actually starts today and runs through Monday, February 16th. At a minimum, it only requires 15 minutes of observation on any or all the days: http://gbbc.birdcount.org/
Happy Cow is a site well-known to many vegetarians/vegans for finding restaurants which I’ve used when travelling. Users can submit reviews and/or restaurants that they’d like profiled (although the site reserves the right to approve or not the listing). http://www.happycow.net/search.html
———————————–
One of the impediments to citizen mapping is the line-of-sight cell tower limitations of mobile phones, or the wifi requirements for other mobile devices. Citizen mapping in urban and suburban environments is well-served by mobile devices, but what about natural areas, dense leaf cover, or extreme topography? Even if obtaining absolute mapping coordinates isn’t the issue, much crowdsourcing assumes an ability to connect back to a central data repository (e.g., a web database, ‘the cloud’). Equipment that can interact with GPS satellites and support data capture is typically expensive and generally requires proprietary software.
wq (https://wq.io/) is a framework that is ‘device first’ and ‘offline-enabled’. It attempts to leverage several open source technologies to build an entire mobile solution that can support citizen science data collection work, and then synchronize with a central repository once the device (and operator) return to an area served by cellular or wifi networks.
I’m stretching here, so if I get stuff wrong, please don’t yell. Still, I’ll take a pass at generally describing the framework and its related technology stack.
wq relies upon python, and a web framework called django for building offline-capable web apps that can run on iOS and Android devices. These web apps, then, rely very heavily upon javascript, particularly requirejs (http://requirejs.org/) and mustache (https://mustache.github.io/), for the templates that permit quick and (somewhat) painless web application development. Data visualization relies upon d3.js (http://d3js.org/), and geography makes heavy use of Leaflet (http://leafletjs.com/) — maybe the most pertinent layer of the stack for those of us in this course. If you’re not familiar withLeaflet.js, check it out!
Finally, wq extends several other open source technologies to enable synchronizing between a central data repository and multiple mobile devices in the hands of citizen mappers. Lastly, wq employs a set of tools to more easily build and distribute customized mapping apps that can be served from Apple’s app store, Google Play, etc.
What wq intends is to allow highly specialized citizen science/citizen mapping apps to be more easily and quickly built, based upon a solid collection of aligned F/OSS tools. Ideally, an app can spin up quickly to respond to a particular need (e.g., a pipeline spill), or a specialized audience (the run up to a public comment period for a development project), or even something like a high school field trip or higher ed service learning project.
Some examples of citizen mapping projects already built upon wq are here:
https://wq.io/examples/
—————–
Creating a walking tour map with Google Earth_2014
————-
Week 3
Podcast includes:
- Geocoding
- Georeferencing
- Spatial Data Formats
- Geospatial Data Online
- Discussion Question
Podcast and Powerpoint available from: http://www.lib.uwaterloo.ca/locations/umd/JuicyLibrarianMaterial.html
Tutorials: BatchGeo (optional); Google Fusion (optional)
https://en.batchgeo.com/
enter Xcel data, and export KLM file ready for google map and/or google earth
https://support.google.com/fusiontables/answer/2571232
http://en.wikipedia.org/wiki/Google_Fusion_Tables
store maps online, no latitude needed.
visualize geospatial data by map
spatial analysis by mapping different layers together
showing data by map, graph or chart
e.g. how many cars cross specific point
crowdsourcing: spotting butterflies, using fusion tables to map the spices and sightings
http://www.theguardian.com/news/datablog/2011/mar/31/deprivation-map-indices-multiple
students: journalism, history, geography.
Georeferencing (geocoding – data, geo referencing – image)
historical air maps or photos are much more useful when they are georeferenced.
Photos from different year is difficult to lay over one another without referencing. the only reference might be the river. usually reference the four corners, but sometimes river. Using GIS program to determine the longitute/latitude for each corner. sometimes only farmland and it is impossible
Information Overload Helps Fake News Spread, and Social Media Knows It
Understanding how algorithm manipulators exploit our cognitive vulnerabilities empowers us to fight back
https://www.scientificamerican.com/article/information-overload-helps-fake-news-spread-and-social-media-knows-it/
a minefield of cognitive biases.
People who behaved in accordance with them—for example, by staying away from the overgrown pond bank where someone said there was a viper—were more likely to survive than those who did not.
Compounding the problem is the proliferation of online information. Viewing and producing blogs, videos, tweets and other units of information called memes has become so cheap and easy that the information marketplace is inundated. My note: folksonomy in its worst.
At the University of Warwick in England and at Indiana University Bloomington’s Observatory on Social Media (OSoMe, pronounced “awesome”), our teams are using cognitive experiments, simulations, data mining and artificial intelligence to comprehend the cognitive vulnerabilities of social media users.
developing analytical and machine-learning aids to fight social media manipulation.
As Nobel Prize–winning economist and psychologist Herbert A. Simon noted, “What information consumes is rather obvious: it consumes the attention of its recipients.”
attention economy
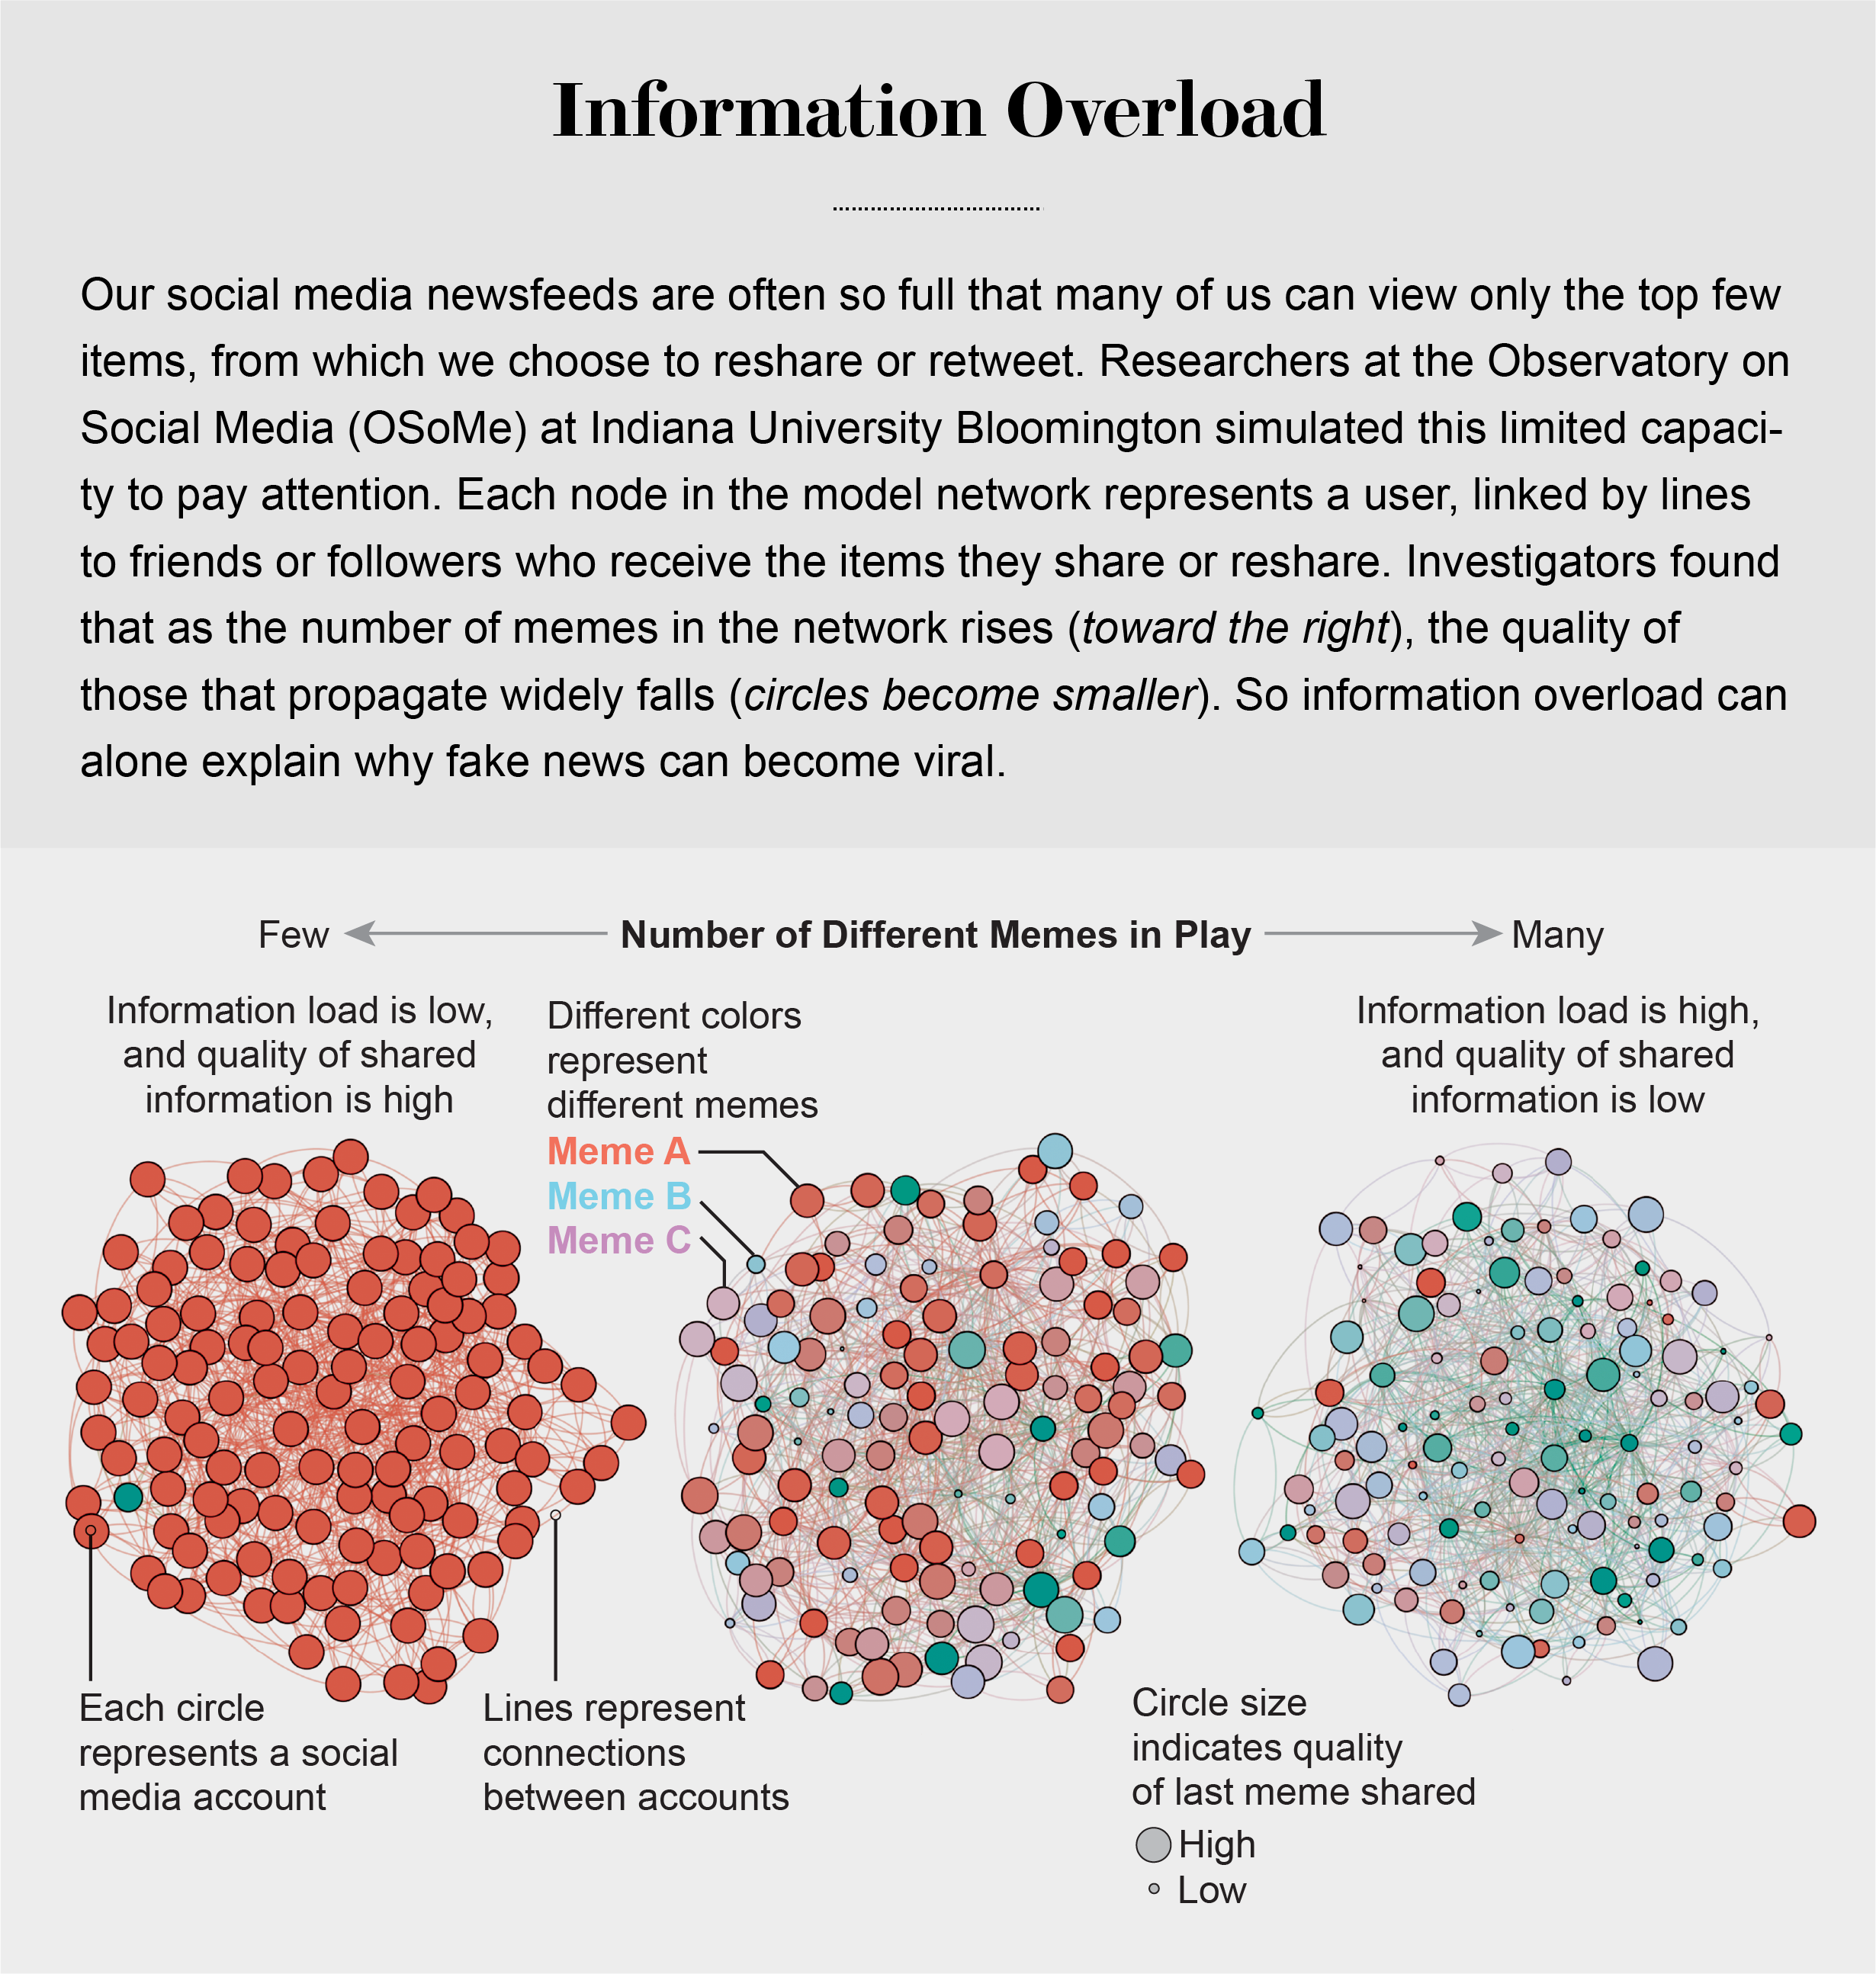
Our models revealed that even when we want to see and share high-quality information, our inability to view everything in our news feeds inevitably leads us to share things that are partly or completely untrue.
Frederic Bartlett
Cognitive biases greatly worsen the problem.
We now know that our minds do this all the time: they adjust our understanding of new information so that it fits in with what we already know. One consequence of this so-called confirmation bias is that people often seek out, recall and understand information that best confirms what they already believe.
This tendency is extremely difficult to correct.
Making matters worse, search engines and social media platforms provide personalized recommendations based on the vast amounts of data they have about users’ past preferences.
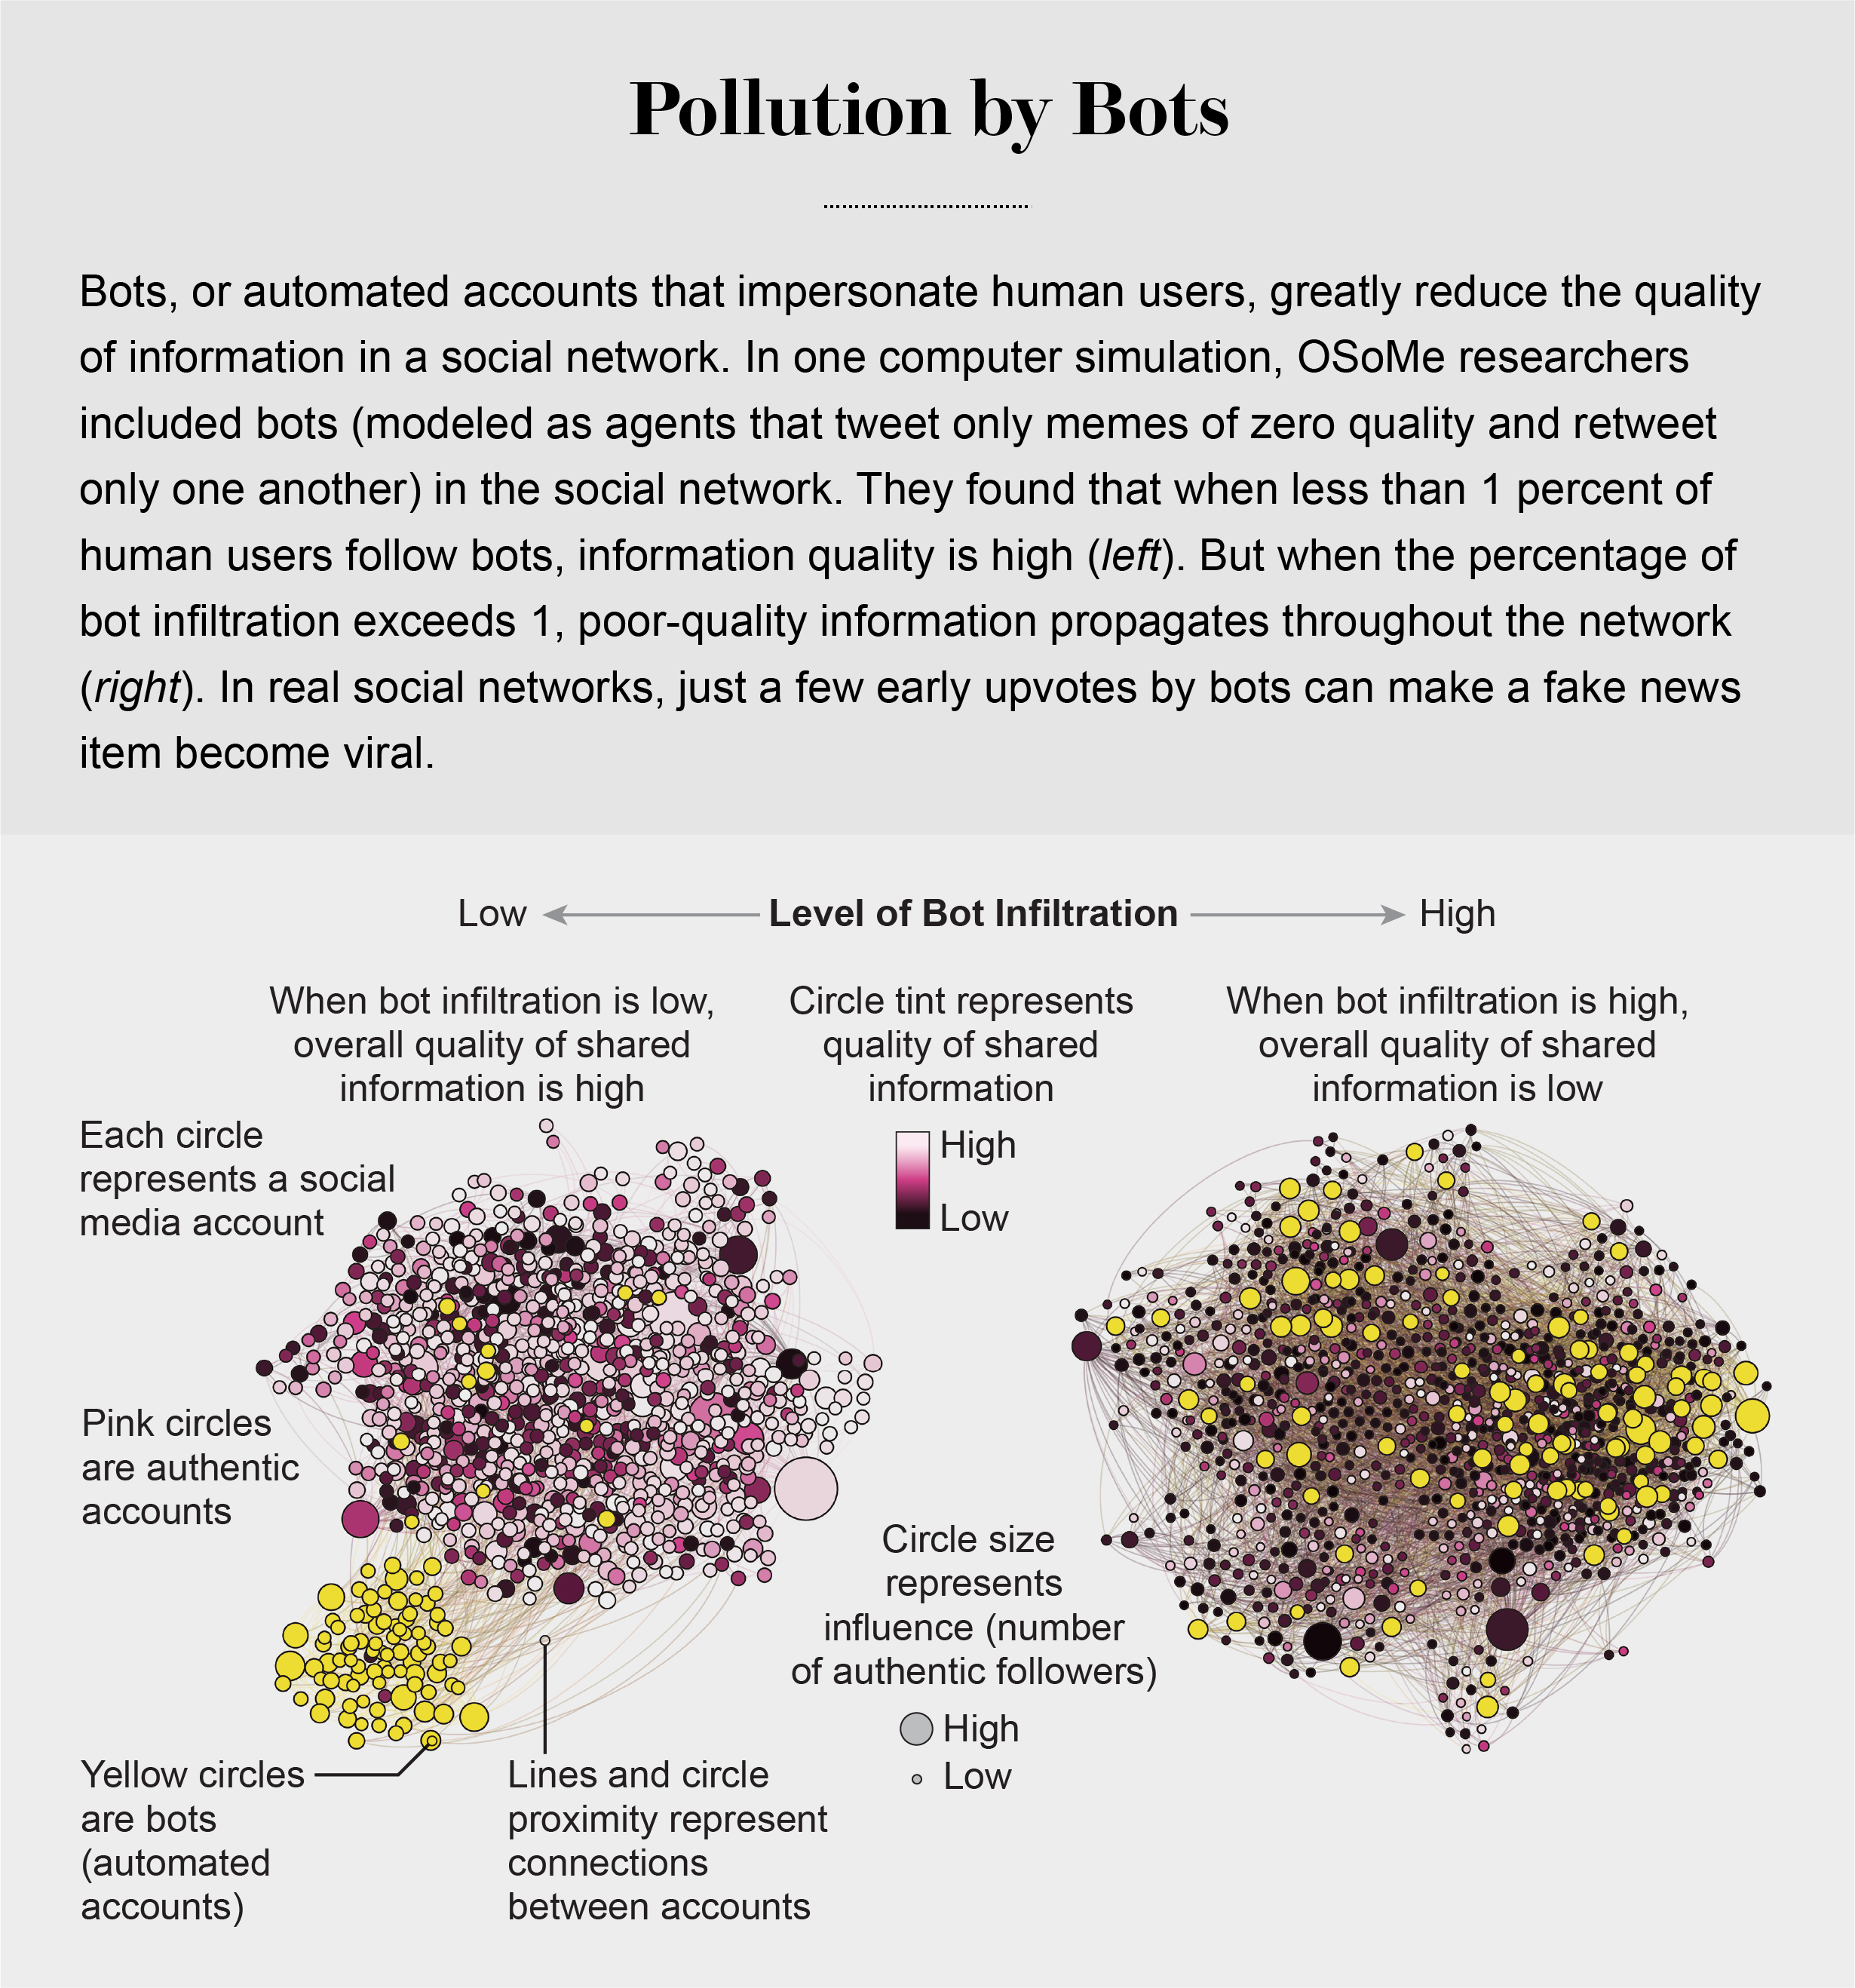
pollution by bots
Social Herding
social groups create a pressure toward conformity so powerful that it can overcome individual preferences, and by amplifying random early differences, it can cause segregated groups to diverge to extremes.
Social media follows a similar dynamic. We confuse popularity with quality and end up copying the behavior we observe.
information is transmitted via “complex contagion”: when we are repeatedly exposed to an idea, typically from many sources, we are more likely to adopt and reshare it.
In addition to showing us items that conform with our views, social media platforms such as Facebook, Twitter, YouTube and Instagram place popular content at the top of our screens and show us how many people have liked and shared something. Few of us realize that these cues do not provide independent assessments of quality.
programmers who design the algorithms for ranking memes on social media assume that the “wisdom of crowds” will quickly identify high-quality items; they use popularity as a proxy for quality. My note: again, ill-conceived folksonomy.
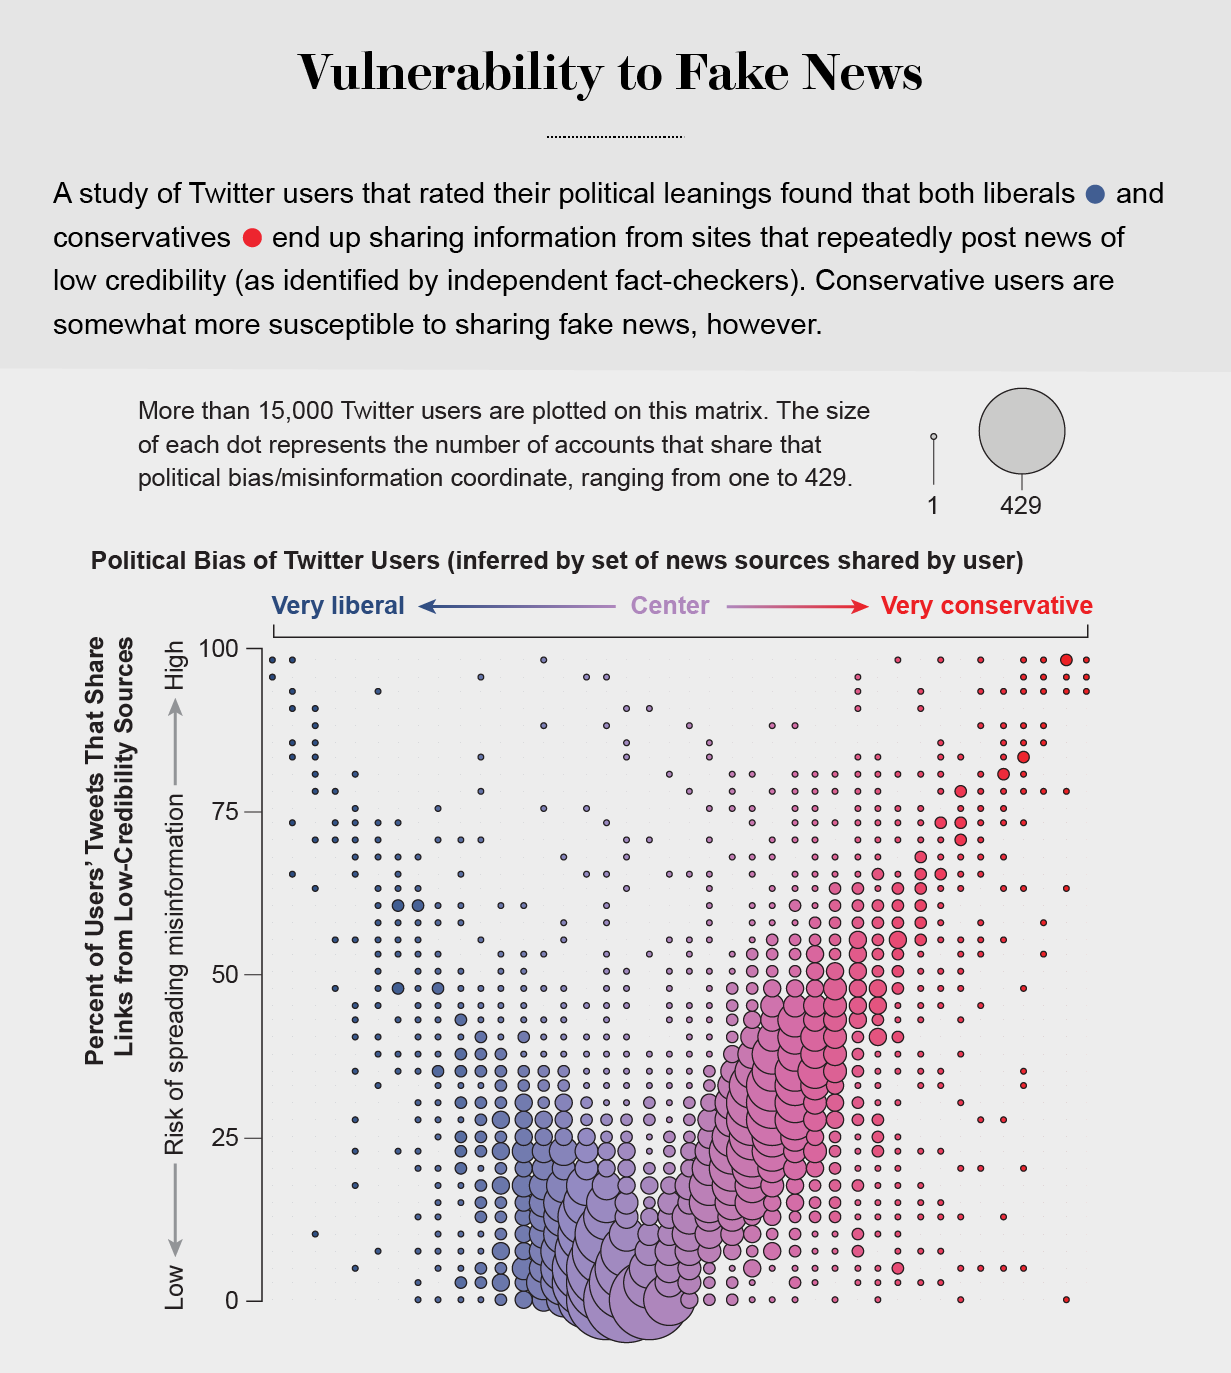
Echo Chambers
the political echo chambers on Twitter are so extreme that individual users’ political leanings can be predicted with high accuracy: you have the same opinions as the majority of your connections. This chambered structure efficiently spreads information within a community while insulating that community from other groups.
socially shared information not only bolsters our biases but also becomes more resilient to correction.
machine-learning algorithms to detect social bots. One of these, Botometer, is a public tool that extracts 1,200 features from a given Twitter account to characterize its profile, friends, social network structure, temporal activity patterns, language and other features. The program compares these characteristics with those of tens of thousands of previously identified bots to give the Twitter account a score for its likely use of automation.
Some manipulators play both sides of a divide through separate fake news sites and bots, driving political polarization or monetization by ads.
recently uncovered a network of inauthentic accounts on Twitter that were all coordinated by the same entity. Some pretended to be pro-Trump supporters of the Make America Great Again campaign, whereas others posed as Trump “resisters”; all asked for political donations.
a mobile app called Fakey that helps users learn how to spot misinformation. The game simulates a social media news feed, showing actual articles from low- and high-credibility sources. Users must decide what they can or should not share and what to fact-check. Analysis of data from Fakey confirms the prevalence of online social herding: users are more likely to share low-credibility articles when they believe that many other people have shared them.
Hoaxy, shows how any extant meme spreads through Twitter. In this visualization, nodes represent actual Twitter accounts, and links depict how retweets, quotes, mentions and replies propagate the meme from account to account.
Free communication is not free. By decreasing the cost of information, we have decreased its value and invited its adulteration.
We define immersive scholarship as any scholarly work developed through or implemented utilizing technologies including Virtual Reality, Augmented Reality, Mixed Reality, Visualization (i.e., large format displays and visualization walls, GIS, Tableau), and any related hardware, programs or software.
We are seeking survey participants who are employed in an academic library and who currently support immersive scholarship and technologies at their institution.
how your academic library has developed tools, implemented third party hardware/software, and in what barriers you have identified at your institution in supporting immersive scholarship.
Link to Online Survey
#LTC2019
keynote: equitable access to information

https://sched.co/JAqk
the type of data: wikipedia. the dangers of learning from wikipedia. how individuals can organize mitigate some of these dangers. wikidata, algorithms.
IBM Watson is using wikipedia by algorythms making sense, AI system
youtube videos debunked of conspiracy theories by using wikipedia.
semantic relatedness, Word2Vec
how does algorithms work: large body of unstructured text. picks specific words
lots of AI learns about the world from wikipedia. the neutral point of view policy. WIkipedia asks editors present as proportionally as possible. Wikipedia biases: 1. gender bias (only 20-30 % are women).
conceptnet. debias along different demographic dimensions.
citations analysis gives also an idea about biases. localness of sources cited in spatial articles. structural biases.
geolocation on Twitter by County. predicting the people living in urban areas. FB wants to push more local news.
danger (biases) #3. wikipedia search results vs wkipedia knowledge panel.
collective action against tech: Reddit, boycott for FB and Instagram.
Mechanical Turk https://www.mturk.com/ algorithmic / human intersection
data labor: what the primary resources this companies have. posts, images, reviews etc.
boycott, data strike (data not being available for algorithms in the future). GDPR in EU – all historical data is like the CA Consumer Privacy Act. One can do data strike without data boycott. general vs homogeneous (group with shared identity) boycott.
the wikipedia SPAM policy is obstructing new editors and that hit communities such as women.
++++++++++++++++++
Twitter and Other Social Media: Supporting New Types of Research Materials
https://sched.co/JAWp
http://z.umn.edu/
 how to access at different levels. methods and methodological concerns. ethical concerns, legal concerns,
tweetdeck for advanced Twitter searches. quoting, likes is relevant, but not enough, sometimes screenshot
engagement option
social listening platforms: crimson hexagon, parsely, sysomos – not yet academic platforms, tools to setup queries and visualization, but difficult to algorythm, the data samples etc. open sources tools (Urbana, Social Media microscope: SMILE (social media intelligence and learning environment) to collect data from twitter, reddit and within the platform they can query Twitter. create trend analysis, sentiment analysis, Voxgov (subscription service: analyzing political social media)
graduate level and faculty research: accessing SM large scale data web scraping & APIs Twitter APIs. Jason script, Python etc. Gnip Firehose API ($) ; Web SCraper Chrome plugin (easy tool, Pyhon and R created); Twint (Twitter scraper)
Facepager (open source) if not Python or R coder. structure and download the data sets.
TAGS archiving google sheets, uses twitter API. anything older 7 days not avaialble, so harvest every week.
social feed manager (GWUniversity) – Justin Litman with Stanford. Install on server but allows much more.
legal concerns: copyright (public info, but not beyond copyrighted). fair use argument is strong, but cannot publish the data. can analyize under fair use. contracts supercede copyright (terms of service/use) licensed data through library.
methods: sampling concerns tufekci, 2014 questions for sm. SM data is a good set for SM, but other fields? not according to her. hashtag studies: self selection bias. twitter as a model organism: over-represnted data in academic studies.
methodological concerns: scope of access – lack of historical data. mechanics of platform and contenxt: retweets are not necessarily endorsements.
ethical concerns. public info – IRB no informed consent. the right to be forgotten. anonymized data is often still traceable.
table discussion: digital humanities, journalism interested, but too narrow. tools are still difficult to find an operate. context of the visuals. how to spread around variety of majors and classes. controversial events more likely to be deleted.
takedowns, lies and corrosion: what is a librarian to do: trolls, takedown,
++++++++++++++
the pilot process. 2017. 3D printing, approaching and assessing success or failure. https://collegepilot.wiscweb.wisc.edu/
development kit circulation. familiarity with the Oculus Rift resulted in lesser reservation. Downturn also.
An experience station. clean up free apps.
question: spherical video, video 360.
safety issues: policies? instructional perspective: curating,WI people: user testing. touch controllers more intuitive then xbox controller. Retail Oculus Rift
app Scatchfab. 3modelviewer. obj or sdl file. Medium, Tiltbrush.
College of Liberal Arts at the U has their VR, 3D print set up.
Penn State (Paul, librarian, kiniseology, anatomy programs), Information Science and Technology. immersive experiences lab for video 360.
CALIPHA part of it is xrlibraries. libraries equal education. content provider LifeLiqe STEM library of AR and VR objects. https://www.lifeliqe.com/
+++++++++++++++++
Access for All:
https://sched.co/JAXn
 Leah Root
bloat code (e.g. cleaning up MS Word code)
ILLiad Doctype and Language declaration helps people with disabilities.
https://24ways.org/
+++++++++++++++++++
A Seat at the Table: Embedding the Library in Curriculum Development
https://sched.co/JAY5
 embed library resources.
libraians, IT staff, IDs. help faculty with course design, primarily online, master courses. Concordia is GROWING, mostly because of online students.
solve issues (putting down fires, such as “gradebook” on BB). Librarians : research and resources experts. Librarians helping with LMS. Broadening definition of Library as support hub.
