PowToon is Web-based animation software that allows users to create animated presentations by manipulating pre-created objects, imported images, provided music and user created voice-overs.[4] Powtoon uses an Adobe Flex engine to generate an XML file that can be played in the Powtoon online viewer, exported to YouTube or downloaded as an MP4 file.[2]
Videomaker, Presentation tool, storytelling tool.
templates versus starting from scratch
having a plan (or a story, or a screenplay)
narrate with voice over your video. can’t edit recording, but can re-record
This session will present results from an evaluation of the integration of RealizeIT adaptive learning technology into three fully online courses: General Psychology, Pathophysiology for Nursing Practice, and College Algebra. Presenters will discuss the impact on students, faculty, and the university.
Adaptive learning systems provide each student with a personalized learning experience, adapting the presentation of the content, and possibly the assessment to the individual ability of the student
==============================================
Co-developed by Learning Technologies and the Faculty Colloquium on Excellence in Teaching and Learning at Indiana University, a digital badge pilot (badges.iu.edu) was launched to support faculty professional development and growth. This session will cover the competency levels, topics of study, and the badging platform to document levels of achievement. Outcomes: Understand the basics of a three-tiered framework for digital badges * Review the online badging platform * Explore topics for faculty development
Mozilla Open Badges 101: Digging into Badges (a webinar)
personalized learning or competency-based does not resolve it. GPA does not respond to employers search
regimenting credentials. digital representation of of skill or achievement. represent achievements on the web. social status (foursquare). granular, evidence-based and transferable. badge ecosystem (across multiple areas), this is why open badges; open system. Open Badge Standard: issuer information; earner information; criteria URL; evidence URL; Standards Alignment; Taxonomy Tags
=============================
Data Visualization: The What, the Who, and the How
Data visualization tools are becoming much stronger and are now targeted at a much wider audience. This panel will explore what we should be trying to do with data visualization, who will be doing it, and how we might support and steer it. OUTCOMES: Identify multiple opportunities for use of data visualization * Learn about multiple user communities, including those not centrally managed * Explore ways to support users and steer them toward good practiceshttp://www.educause.edu/sites/default/files/library/presentations/E15/SESS029/Data%2BViz%2BEducause%2B151028%2BFINAL1.pptxslides 7: What works well for technically savvy developers may not work for faculty or staff without those same credentials.
Data Wrapper
Raw
Infogram
Tableau
Oracle suite of OBIEE (Oracle Business Intelligence Enterprise Edition) has been very successful for CSU
Cognos (IBM) is another tool that is very popular for developers and has been used by USG central office
D3 (For Data Driven Documents)
Fusion Charts
Chart js
Google Charts
slide 11: Two primary design goals supported through Data Visualization:
Discovery and Exploration
–What story is the data telling you
–Identify patterns and exceptions
Decision-making
–Compare, contrast, choose
–Explain, make a point, decide
slide 15:
qTo communicate
qPresent more clearly or more forcefully than would be accomplished with text or tables
qReports, dashboards, infographics, etc.
qTo discover
qAllow us to see what would be difficult or impossible to see if not presented in a useful visualization
qRealm of research but moving into the mainstream
qCan same visualization serve both purposes?
======================
iPad, You Pad, We All Pad: Transforming Teaching and Learning
California State University Northridge, Lynn University, and Jackson State University have all deployed one-to-one iPad tablet initiatives, with the objectives to increase student engagement and learning, improve the quality of teaching materials, and decrease student costs. This session will discuss the transformational educational opportunities afforded by the iPad and highlight technology and pedagogical lessons learned. Outcomes: Learn about the transformational impact of one-to-one iPad initiatives in the classroom * Understand the need for extensive faculty development and faculty adoption strategies * Appreciate deployment and support challenges====================
The Avalon Video and Audio Repository for Libraries and Beyond
The Avalon Media System provides an open-source streaming media solution, based on Hydra/Fedora repository technologies, focused on delivery of library media collections, but it is finding other uses, including support for publication, teaching and learning content, and digital scholarship. As a result, new features enhance support for additional research and instructional use cases. Outcomes: Understand the problems Avalon solves * Understand the extended use cases addressed with Avalon, both present and intended future * Learn how best to engage with the Avalon project.========================
The Karuta Open Source Portfolio, currently under incubation by the Apereo Foundation, offers dramatic flexibility for designing portfolio workflows with rubrics to assess learning outcomes. Karuta is LTI enabled for integration with the LMS for easy access and transfer of evidence of learning. Subsequent releases will add functionality for showcasing as well as reporting. Outcome: Learn how Karuta can flexibly support your programs and institution through leveraging its functionality
=======================
Supporting the Discovery and Adoption of Open E-Textbooks
The California Open Education Resources Council comprises faculty from the three CA higher education systems working together to identify open textbooks for high impact courses. The selected open textbooks are in the process of being peer reviewed and curated in the CA Open Online Library. Outcomes: Identify quality open textbooks for general education, high-impact courses * Learn how to interpret textbook peer reviews with a faculty-created rubric * Understand how to reference these resources for the discovery of quality no- or low-cost materialshttp://www.educause.edu/sites/default/files/library/presentations/E15/PS58/COOL%2BEducause%2BPoster%2B2015.pdf
====================
Seminar 12P – Six Secrets for Evaluating Online Teaching (separate registration is required)
What makes online teaching different from face-to-face teaching? How can we tell when it’s done well? Faculty members, administrators, and IT leaders will learn six evaluation “secrets” from the authors of the new book Evaluating Online Teaching. You will leave this seminar with use-them-now strategies, tools, and templates to take back to your campus. OUTCOMES: Distinguish online content and practices that “count” as teaching behaviors * Design self-, peer-, and administrative-evaluation analytic tools * Develop a 6-stage, campus-wide program for evaluating online teachinghttp://www.educause.edu/annual-conference/2015/seminar-12p-six-secrets-evaluating-online-teaching-separate-registration-required
Learn how the University of Pittsburgh is creating a scalable classroom model for active learning on a traditional campus. Administrators, faculty, and instructional technologists and designers recently collaborated to reimagine legacy large-enrollment lecture halls. The focus of this session is on the learning space design process across the disciplines. Outcomes: Identify and apply the principles of active learning associated with learning space deign * Understand the design process * Assemble an effective learning space design teamhttp://www.educause.edu/annual-conference/2015/reimagining-learning-space-design-across-disciplines
==============================
Thinking Digitally: Advancing Digital Literacy with Personalized Learning Tools
The session will outline a scalable framework for integrating digital literacy in higher education curriculum, supported by tools that allow for active and personalized learning. Research and examples from Georgia State University’s experience implementing a pilot program will be used as a catalyst for interactive discussion and idea generation. Outcomes: Understand the value of incorporating digital literacy into curriculum * Select from emerging personalized learning technologies to support digital literacy across diverse academic scenarios * Adapt a methodology for developing partnerships to advance digital literacy across the organizationhttp://www.educause.edu/annual-conference/2015/thinking-digitally-advancing-digital-literacy-personalized-learning-tools===============
A discussion of unmanned aerial vehicles (drones) and drone activities that either take place on campus or impact a campus from the outside. The state of federal aviation regulations and guidelines for drones will be covered. Attendees can share their experiences with official and rogue drone activities at their institutions. Outcomes: Learn about the drone devices in use, from miniature to massive * Understand the impact of drones on academic institutions, for better or worse * Learn what drone activities are legally allowable, banned, or discouragedhttp://www.educause.edu/annual-conference/2015/whats-droning-overhead
Resources – Higher Ed Drone Policies
The Ohio State University
Iowa State University
Indiana University
University of Kansas
Penn State University
University of New Mexico
The Association of College and University Policy
Administrators (ACUPA, acupa.org)
Join this lively discussion and discovery of innovative and functional uses and support for mobile computing. We will explore creative ideas for projects using mobile devices in teaching, learning, and administration. Topics may include hardware, applications, tools, special uses, wireless and mobile connectivity, web services, support issues, and security.
* why do I need to know this: it is a trending quick and effective way to visualize numbers (stats)
* what is my assignment: create a MEANINGFUL infographic
* how I will be evaluated: assess the infographic and your strategy to make it public
– why infographics matter. Why is it more then just another alternative to PowerPoint
– what is an infographic: a portmanteau of information + graphic
– what are the cloud-based tools: Pictochart, Easilly and Infogram
– why are stats so important for infographics
– where are the stats to be found for the infographics
– how much stats and math needs one to know, to create a meaningful infographic
– how can infographics be promoted effectively, inexpensively and quickly
the use of social media, personal versus institutional, or personal in the context of an institutional repercussions, is a complex and thorny issue. How much can one criticize the institution in their personal social media? And if the institution responds, when does it become silencing the social media as expression of free speech?
Is the article below touching only a specific [political] issue, or academia, as an institution, goes beyond this issue in imposing on freedom of speech?
My tweets might appear uncivil, but such a judgment can’t be made in an ideological or rhetorical vacuum. Insofar as “civil” is profoundly racialized and has a long history of demanding conformity, I frequently choose incivility as a form of communication. This choice is both moral and rhetorical.
Academics are usually eager to contest censorship and deconstruct vague charges of vulgarity. When it comes to defending Israel, though, anything goes.
Students are capable of serious discussion, of formulating responses, of thinking through discomfort. They like my teaching because I refuse to infantilize them; I treat them as thinking adults. My philosophy is simple: Teach them the modes and practices of critical thought and let them figure out things on their own.
Professors are often punished for disrupting convention in informal ways, however. My case is interesting because administrators ignored the de facto standards that regulate our behavior and exercised their power directly. This should be worrisome to any scholar who isn’t a sycophant.
The coming of “academic capitalism” has been anticipated and praised for years; today it is here.
Benjamin Ginsberg points out that in the past 30 years, the administrator-to-student ratio has increased while the instructor-to-student ratio has stagnated. The rise of untenured, or non-tenure-track, faculty exacerbates the problem; a significant demographic in academe lacks job security or the working conditions that allow them to maximize their pedagogical talent. Over a recent 10-year period, spending on administration outpaced spending on instruction. At American universities, there are now more administrators and their staffers than full-time faculty. In the past 10 years, administrative salaries have steadily risen while custodians and groundskeepers suffer the inevitable budget cuts — as do the students whose tuition and fees supplement this largess.
When so much money is at stake, those who raid the budget have a deep interest in maintaining the reputation of the institution. Their privilege and the condition of the brand are causally related. The brand thus predominates. Its predominance often arrives at the expense of student well-being.
critical thinking is a terribly undesirable quality in the corporate world, much more damning than selfishness or sycophancy. Let us then be honest about critical thinking: On the tongues of cunning bureaucrats, it is little more than an additive to brand equity, the vainglorious pomp of smug, uptight automatons who like to use buzzwords in their PowerPoint presentations.
Critical thinking by faculty is even more undesirable. In research institutions, we are paid to generate prestige and to amass grant money; in teaching-centered colleges, we enjoy excess enrollments according to fine-tuned equations that maximize the student-teacher ratio. (In elite liberal-arts colleges, we pamper the kids with simulations of parental affection.) Critical thinking is especially harmful to adjuncts, reliant as they are for income on the munificence of well-paid bosses who cultivate a distended assemblage of expendable employees.
As repeated by me for years, PPT should not be the one and only. Here are some choices. Please consider that IMS delivers workshops, one-on-one sessions and class sessions on the applications listed below:
Faculty request to lay voice over a presentation with pictures. Solutions:
PowerPoint:
Windows / PC
ppt voice over
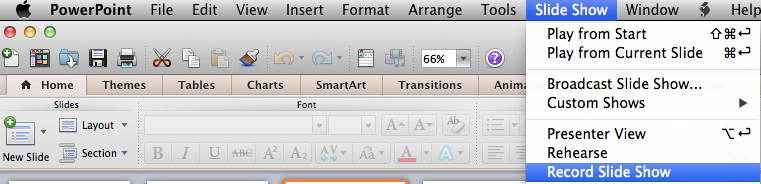
Apple/Mac
voice over PPT on Apple
advantages:
– unfortunately, faculty are way too familiar with PPT. Familiar to the point that they don’t want to try something better.
– FERPA complient
disadvantages:
– too old. PPT is pre-Internet. It does not matter how much Microsoft is trying to adapt it, the concept is old. There is a myriad of cloud-based solutions, which do better job: https://blog.stcloudstate.edu/ims/2013/09/30/the-5-best-free-slideshow-presentation-and-creation-tools-for-teachers/
– too many files, too many variations
– PPT posted in D2L displays in the D2L Viewer. The visuals are there, but the voice is not. In order to hear the voice, students must download the presentation. Faculty must reflect this in the syllabus.
– faculty need to know how to upload on their web space and figure out URL, if PPT is not place in LMS (D2L)- if faculty places PPT in LMS (D2L), then it is behind password; nearly impossible to share (can share only with SCSU and/or MnSCU members.
– faculty must remember to indicate in the syllabus and/or D2L / Content that “in order to hear the voice over, user must download presentation.”
SlideShare
slideshare
advantages:
– it is a “social” app, like LinkedIn and Twitter. Tagged correctly, the presentation is a platform for “same-minded” people to discuss mutual interests.
– excellent for sharing: conferences, MOOCs etc.
– it has discussion group in LinkedIn.
disadvantages:
– voice over presentation: way to cumbersome compared to PPT. Watch their presentation
– by FERPA regulations, if the presentation contains personal data about students, it cannot be shared on SlideShare
– it is a “social” app, like LinkedIn and Twitter. Tagged correctly, the presentation is a platform for “same-minded” people to discuss mutual interests.
– excellent for sharing: conferences, MOOCs etc.
– like PPT, very easy upload of pix and voice over. Better the PPT, since it is online and easy to distribute.
– easy to upload PPT and easy to voice over each slide
disadvantages:
– does not embed in D2L (it is D2L issue, not the app), but works perfectly as a link
– faculty must remember to indicate in the syllabus and/or D2L / Content that when clicking on the URL to the PPT, user must simultaneously press “Ctrl” key to open PPT in a separate browser window or tab
– by FERPA regulations, if the presentation contains personal data about students, it cannot be shared on SlideShare
– consistently voted through last 5 years by K12 educators as great interactive tool.
– video, images, audio and text.
– “constructivist” premiss: teacher and students can exchange asynchronously ideas by using images, video, text and audio.
disadvantages:
– free option has limited features.
– by FERPA regulations, if the presentation contains personal data about students, it cannot be shared on on this site.
– voice over too complex (very much the same as with SlideShare)
SoftChalk
advantages:
– FERPA compliant; endorsed by MnSCU
disadvantages:
–
others
I have not included TechSmit’s Jing https://www.techsmith.com/jing.html, because their video output (Flash file) is obsolete and impossible to convert for free. While it still can be played, shall faculty want to upload the video file on Youtube or similar social media, it will be impossible.
Since the emergence of easily accessible dynamic online mapping tools, there has been a drastic increase in geographic interest and awareness. Whether for personal, social, professional or academic uses, people are using Geographic Information System (GIS) technology to communicate information in a map format. Whether it’s using Google Earth to study urban change, or creating Google Map Mashups to deliver library resources, more and more members of society are turning to mapping programs for their visualization needs. With so many using GIS technology in their daily lives, library staff are now more than ever assisting library clients with their mapping queries.
This course will introduce students to a variety of mapping tools and GIS technologies such Google Earth and the creation of dynamic KML files; ArcGIS Online and webmap publishing; Google Fusion Tables and geocoding; and GIS fundamentals with geospatial data creation. Students will be able to apply their GIS skills in their reference work, in digitization projects, in webpages, in library instruction, and more. Through hands-on exercises, pre-recorded demonstrations and lectures, students will receive a thorough overview of mapping resources that will enhance and expose their library’s resources.
Discover some citizen mapping projects that you are interested inOR
Contribute your local knowledge to Google Map MakerANDShare with the class online
2. Google Earth Map
Please complete the tutorial and then create a map in Google Earth with the following components:
A title
A written introduction to your project
At least five placemarks, embedded with html tags, and images, if possible.
Imported KML file(s) file format by GEarth, but other apps is using it. using notepad or MS Word, one can create KML file.
screen overlay, can be text, image, anything. legend. HTML code.
A screen overlay (i.e. a legend)
areal photography.
history.
images from the library, Google is willing to buy them. citizen mapping. scanning and uploading.
geographical and societal awareness.
Gallery: 360Cities.
google street view – historical views
Google Earth Mapping
Submit online as a KML/KMZ file
I had the opportunity to experience a gizmo that can be used to display a variety of mapping projects, including citizen mapping:Science on a Sphere. It is a sphere on which you can project static maps or animations. The one I saw, in the National Oceanic and Atmospheric Administration’s facility on Ford Island in Honolulu, displayed animations showing the 2004 Indian Ocean tsunami and the 2011 tsunami in Japan, as well as airline flight paths, ocean currents, polar ice cap change over time, and many other types of geospatial data.
The Great Backyard Bird Count actually starts today and runs through Monday, February 16th. At a minimum, it only requires 15 minutes of observation on any or all the days: http://gbbc.birdcount.org/
Happy Cow is a site well-known to many vegetarians/vegans for finding restaurants which I’ve used when travelling. Users can submit reviews and/or restaurants that they’d like profiled (although the site reserves the right to approve or not the listing).http://www.happycow.net/search.html
One of the impediments to citizen mapping is the line-of-sight cell tower limitations of mobile phones, or the wifi requirements for other mobile devices. Citizen mapping in urban and suburban environments is well-served by mobile devices, but what about natural areas, dense leaf cover, or extreme topography? Even if obtaining absolute mapping coordinates isn’t the issue, much crowdsourcing assumes an ability to connect back to a central data repository (e.g., a web database, ‘the cloud’). Equipment that can interact with GPS satellites and support data capture is typically expensive and generally requires proprietary software.
wq(https://wq.io/) is a framework that is ‘device first’ and ‘offline-enabled’. It attempts to leverage several open source technologies to build an entire mobile solution that can support citizen science data collection work, and then synchronize with a central repository once the device (and operator) return to an area served by cellular or wifi networks.
I’m stretching here, so if I get stuff wrong, please don’t yell. Still, I’ll take a pass at generally describing the framework and its related technology stack.
wq relies upon python, and a web framework called django for building offline-capable web apps that can run on iOS and Android devices. These web apps, then, rely very heavily upon javascript, particularly requirejs (http://requirejs.org/) and mustache (https://mustache.github.io/), for the templates that permit quick and (somewhat) painless web application development. Data visualization relies upon d3.js (http://d3js.org/), and geography makes heavy use of Leaflet (http://leafletjs.com/) — maybe the most pertinent layer of the stack for those of us in this course. If you’re not familiar withLeaflet.js, check it out!
Finally, wq extends several other open source technologies to enable synchronizing between a central data repository and multiple mobile devices in the hands of citizen mappers. Lastly, wq employs a set of tools to more easily build and distribute customized mapping apps that can be served from Apple’s app store, Google Play, etc.
What wq intends is to allow highly specialized citizen science/citizen mapping apps to be more easily and quickly built, based upon a solid collection of aligned F/OSS tools. Ideally, an app can spin up quickly to respond to a particular need (e.g., a pipeline spill), or a specialized audience (the run up to a public comment period for a development project), or even something like a high school field trip or higher ed service learning project.
Some examples of citizen mapping projects already built upon wq are here:
store maps online, no latitude needed.
visualize geospatial data by map
spatial analysis by mapping different layers together
showing data by map, graph or chart
e.g. how many cars cross specific point
crowdsourcing: spotting butterflies, using fusion tables to map the spices and sightings http://www.theguardian.com/news/datablog/2011/mar/31/deprivation-map-indices-multiple
students: journalism, history, geography.
Georeferencing (geocoding – data, geo referencing – image)
historical air maps or photos are much more useful when they are georeferenced.
Photos from different year is difficult to lay over one another without referencing. the only reference might be the river. usually reference the four corners, but sometimes river. Using GIS program to determine the longitute/latitude for each corner. sometimes only farmland and it is impossible
There is an informative discussion on the LITA board regarding signage, both hard/software-wise as well as design-wise.
From: Hess, M. Ryan [mailto:MHESS8@depaul.edu] Sent: Monday, January 05, 2015 6:14 PM To:lita-l@lists.ala.org Subject: [lita-l] Re: Digital Signs – Best practices, hints & tips
Hi Christa,
I don’t manage the signs in our library, but had a part in getting them put in place and designing workflows. Along the way, I found some interesting research on the topic:
San Jose Public Library (2009). San Jose Public Library Signage Design Guidelines. Retrieved from http://www.olis.ri.gov/ services/ ce/ presentation/ SJW-SignageDesignGuidelines.pdf
Barclay, D. A., Bustos, T., & Smith, T. (June 01, 2010). Signs of success. College & Research Libraries News, 71(6), 299.
Shooting more from the hip, my opinion on digital signage is that commonly made mistakes with content include:
– multiplied narratives don’t work in most library cases. Keep everything short and on a single slide
– keep the slide visible for at least a minute to give people a chance to read it
– make sure your graphics are appropriately sized for HD screens (keep those images sharp and avoid pixelation)
On a technical note, we use a mix of solutions:
– PPTs on USBs
– We’ve experimented with Google Drive Slideshows too, to help streamline the work
M Ryan Hess
Digital Services Coordinator
DePaul University
JTR 303-C, DePaul University, Lincoln Park Campus, 2350 N Kenmore Ave., Chicago IL 60614
office: 773-325-7829 | cell: 650-224-7279 | fax: 773-325-2297 | mhess8@depaul.edu
We are using a Plex Media Server feeding 3 Rokus over a wireless connection from a laptop. We use .jpg pictures for our slides. Each Roku is connected to a different folder on the Plex server since our displays are in different parts of the building.
Edward
—–Original Message—–
From: Junior Tidal [mailto:JTidal@CityTech.Cuny.Edu]
Sent: Monday, December 22, 2014 1:10 PM
To: lita-l@lists.ala.org
Subject: [lita-l] Re: Digital Signs – Best practices, hints & tips
Hi Christa,
We used two templates for our digital sign. We were using PowerPoint on a Windows machine.
Librarians would take turns updating the slides to promote databases, workshops, library hours, etc., and we had a stable of maybe a dozen or so slides. We updated the slides whenever we needed to promote specific events, usually a couple of weeks before it took place.
This made it much easier to update the slides, because we couldn’t remotely login into the PC with Powerpoint running. Now, we can connect to the RPi/Screenly, and upload images.
Best,
Junior
Junior Tidal
Assistant Professor
Web Services and Multimedia Librarian
New York City College of Technology, CUNY
300 Jay Street, Rm A434
Brooklyn, NY 11201
718.260.5481
Apple created the A8X processor specifically for the iPad Air 2. The new chip has a second-generation 64-bit architecture, houses 3 billion transistors, and compared to the iPhone 6‘s A8 chip, has a 40 percent faster CPU, while its GPU is 2.5 times faster.
rear 8-megapixel iSight camera boasts a new sensor to capture 3,264×2,448 resolution photos and 1080p HD video.
Apple added an impressive anti-reflective coating to the iPad Air 2, which allegedly reduces glare by 56 percent.
Sophia: Nudged along by my friend Todd Nesloney, I use Sophia for my computer applications instruction and am very pleased with the results.
Haiku Learning: This is the full content management system that I’m trying to get our school to adopt. It’s multiplatform and robust, which makes it a great fit for our BYOD environment.
There are many other apps like Moodle, Canvas, and Coursesites. The point is that you should have one in a BYOD environment.
Assessment Aids
All three of these apps — Quick Key, Grade Ninja, and WISE — are available on iTunes and Google Play, but there are more.
If you’re working with multiple apps like Google Drive, Dropbox, One Drive, Evernote and need to search across them in one shot, take a look at Xendo (http://xen.do) – gives you a personal, private Google-like search across all your apps.