Bibliographical data analysis with Zotero and nVivo
Bibliographic Analysis for Graduate Students, EDAD 518, Fri/Sat, May 15/16, 2020
This session will not be about qualitative research (QR) only, but rather about a modern 21st century approach toward the analysis of your literature review in Chapter 2.
However, the computational approach toward qualitative research is not much different than computational approach for your quantitative research; you need to be versed in each of them, thus familiarity with nVivo for qualitative research and with SPSS for quantitative research should be pursued by any doctoral student.
Once you complete the overview of the resources above, please make sure you have Zotero working on your computer; we will be reviewing the Zotero features before we move to nVivo.
Familiarity with Zotero is a prerequisite for successful work with nVivo, so please if you are already working with Zotero, try to expand your knowledge using the materials above.
Please use this link to install nVivo on your computer. Even if we were not in a quarantine and you would have been able to use the licensed nVivo software on campus, for convenience (working on your dissertation from home), most probably, you would have used the shareware. Shareware is fully functional on your computer for 14 days, so calculate the time you will be using it and mind the date of installation and your consequent work.
For the purpose of this workshop, please install nVivo on your computer early morning on Saturday, May 16, so we can work together on nVivo during the day and you can continue using the software for the next two weeks.
Please familiarize yourself with the two articles assigned in the EDAD 815 D2L course content “Practice Research Articles“ :
Brosky, D. (2011). Micropolitics in the School: Teacher Leaders’ Use of Political Skill and Influence Tactics. International Journal of Educational Leadership Preparation, 6(1). https://eric.ed.gov/?id=EJ972880
Tooms, A. K., Kretovics, M. A., & Smialek, C. A. (2007). Principals’ perceptions of politics. International Journal of Leadership in Education, 10(1), 89–100. https://doi.org/10.1080/13603120600950901
It is very important to be familiar with the articles when we start working with nVivo.
whereas the snapshots are replaced with snapshots from nVivol, version 12, which we will be using in our course and for our dissertations.
Concept of bibliographic data
Bibliographic Data is an organized collection of references to publish in literature that includes journals, magazine articles, newspaper articles, conference proceedings, reports, government and legal publications. The bibliographical data is important for writing the literature review of a research. This data is usually saved and organized in databases like Mendeley or Endnote. Nvivo provides the option to import bibliographical data from these databases directly. One can import End Note library or Mendeley library into Nvivo. Similar to interview transcripts, one can represent and analyze bibliographical data using Nvivo. To start with bibliographical data representation, this article previews the processing of literature review in Nvivo.
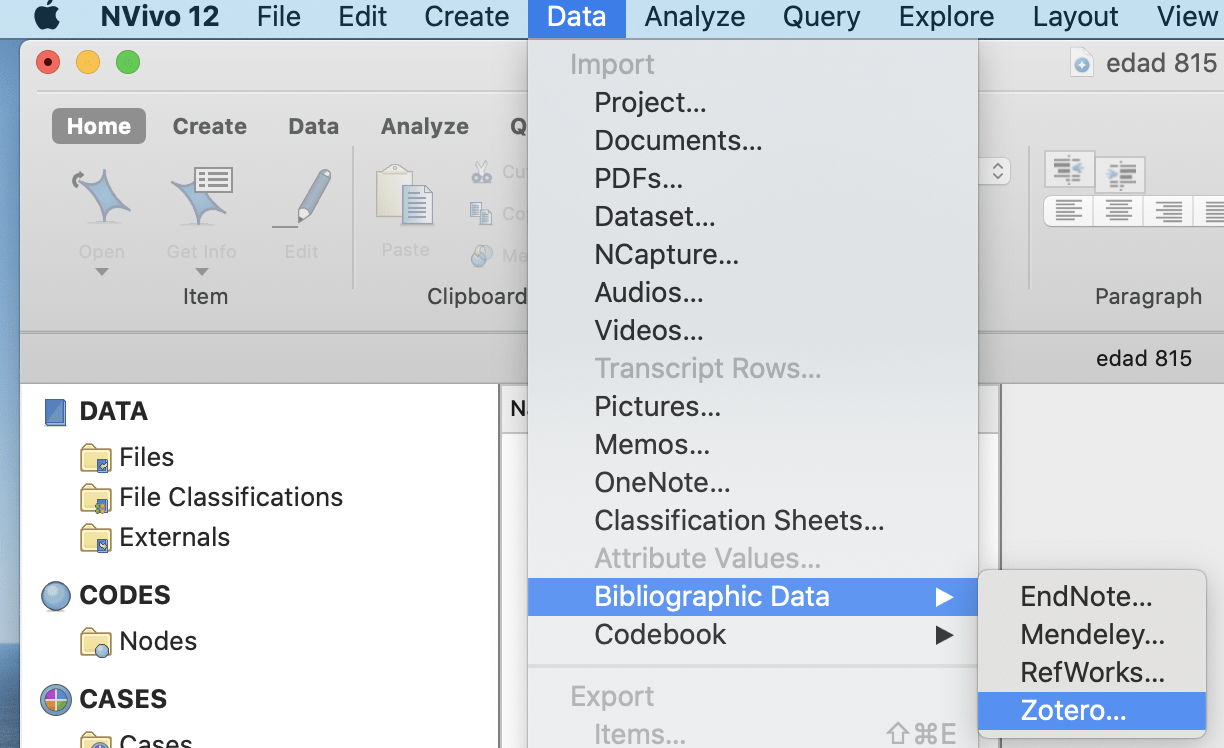
Importing bibliographical data
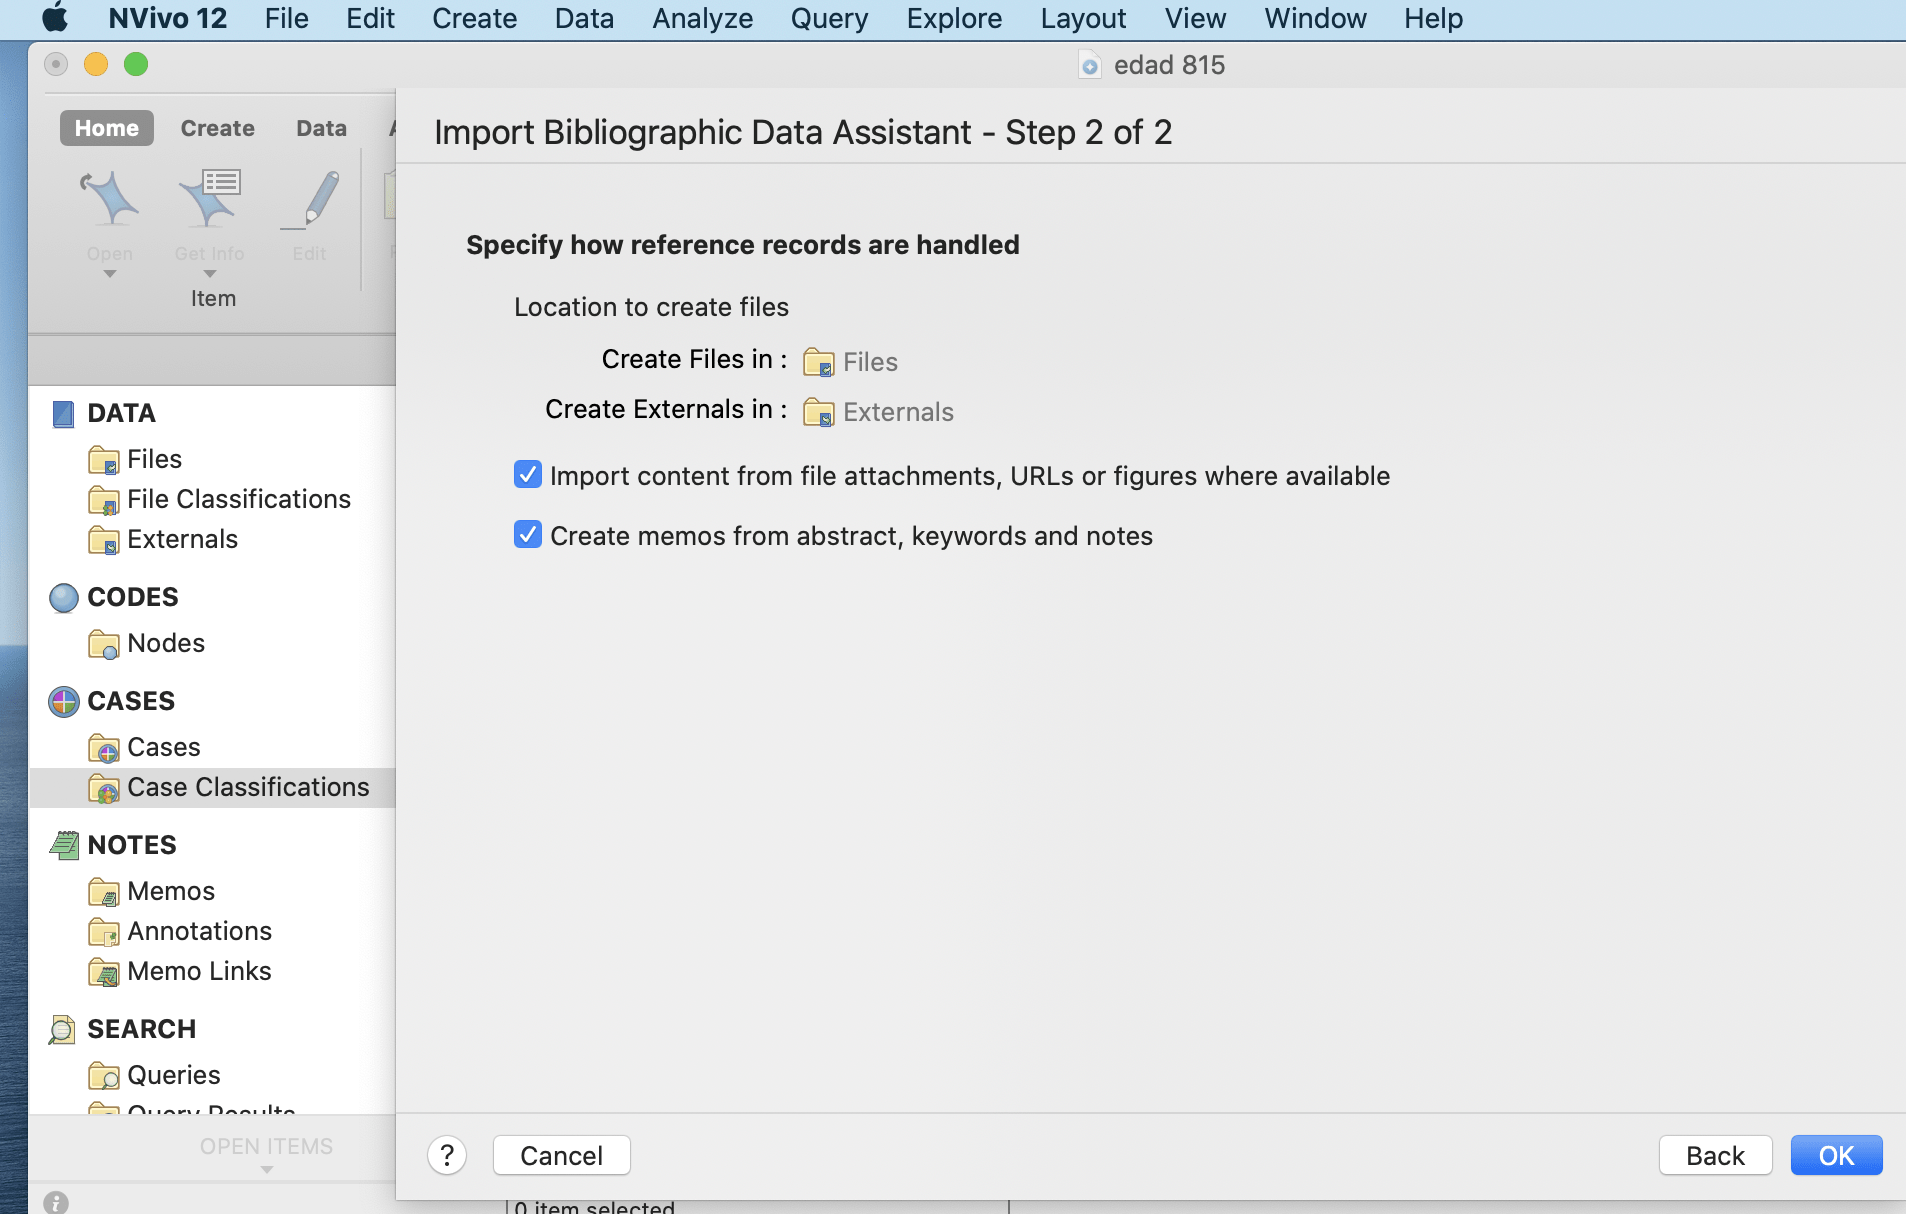
Bibliographic Data is imported using Mendeley, Endnote and other such databases or applications that are supported with Nvivo. Bibliographical data here refers to material in the form of articles, journals or conference proceedings. Common factors among all of these data are the author’s name and year of publication. Therefore, Nvivo helps to import and arrange these data with their titles as author’s name and year of publication. The process of importing bibliographical data is presented in the figures below.
select the appropriate data from external folder
Coding strategies for literature review
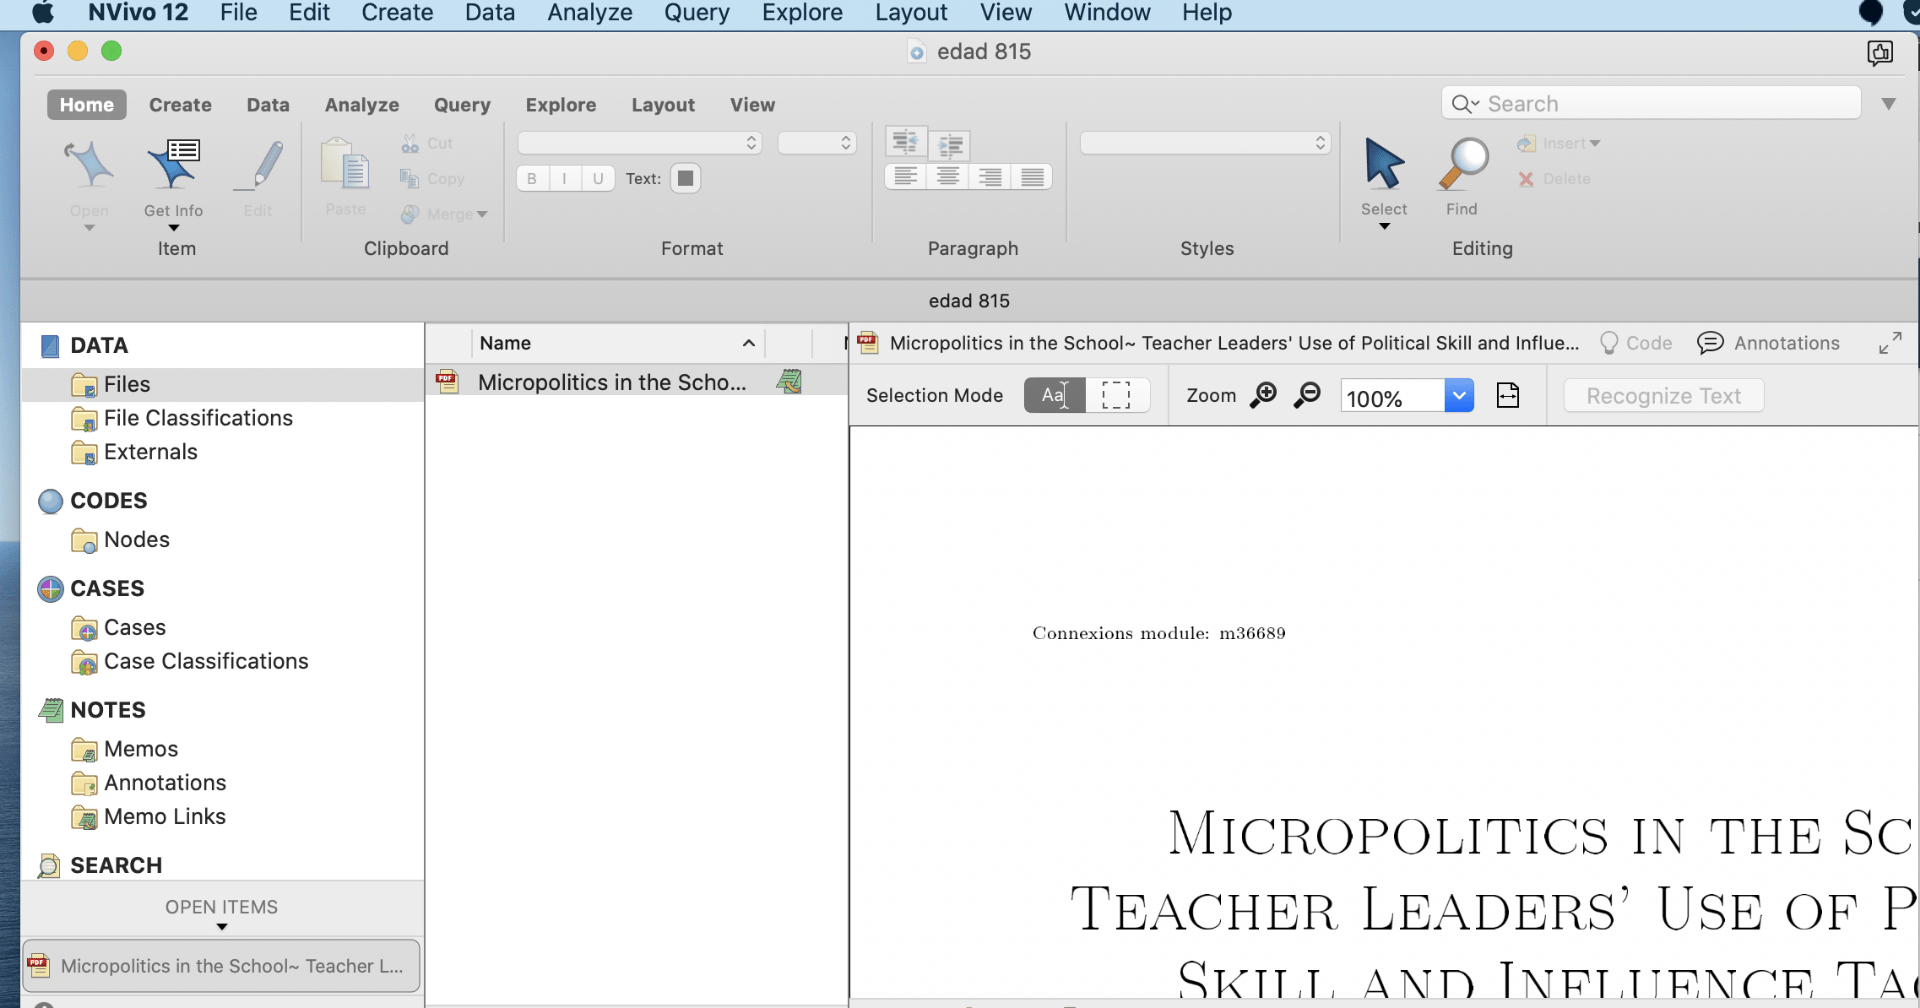
Coding is a process of identifying important parts or patterns in the sources and organizing them in theme node. Sources in case of literature review include material in the form of PDF. That means literature review in Nvivo requires grouping of information from PDF files in the forms of theme nodes. Nodes directly do not create content for literature review, they present ideas simply to help in framing a literature review. Nodes can be created on the basis of theme of the study, results of the study, major findings of the study or any other important information of the study. After creating nodes, code the information of each of the articles into its respective codes.
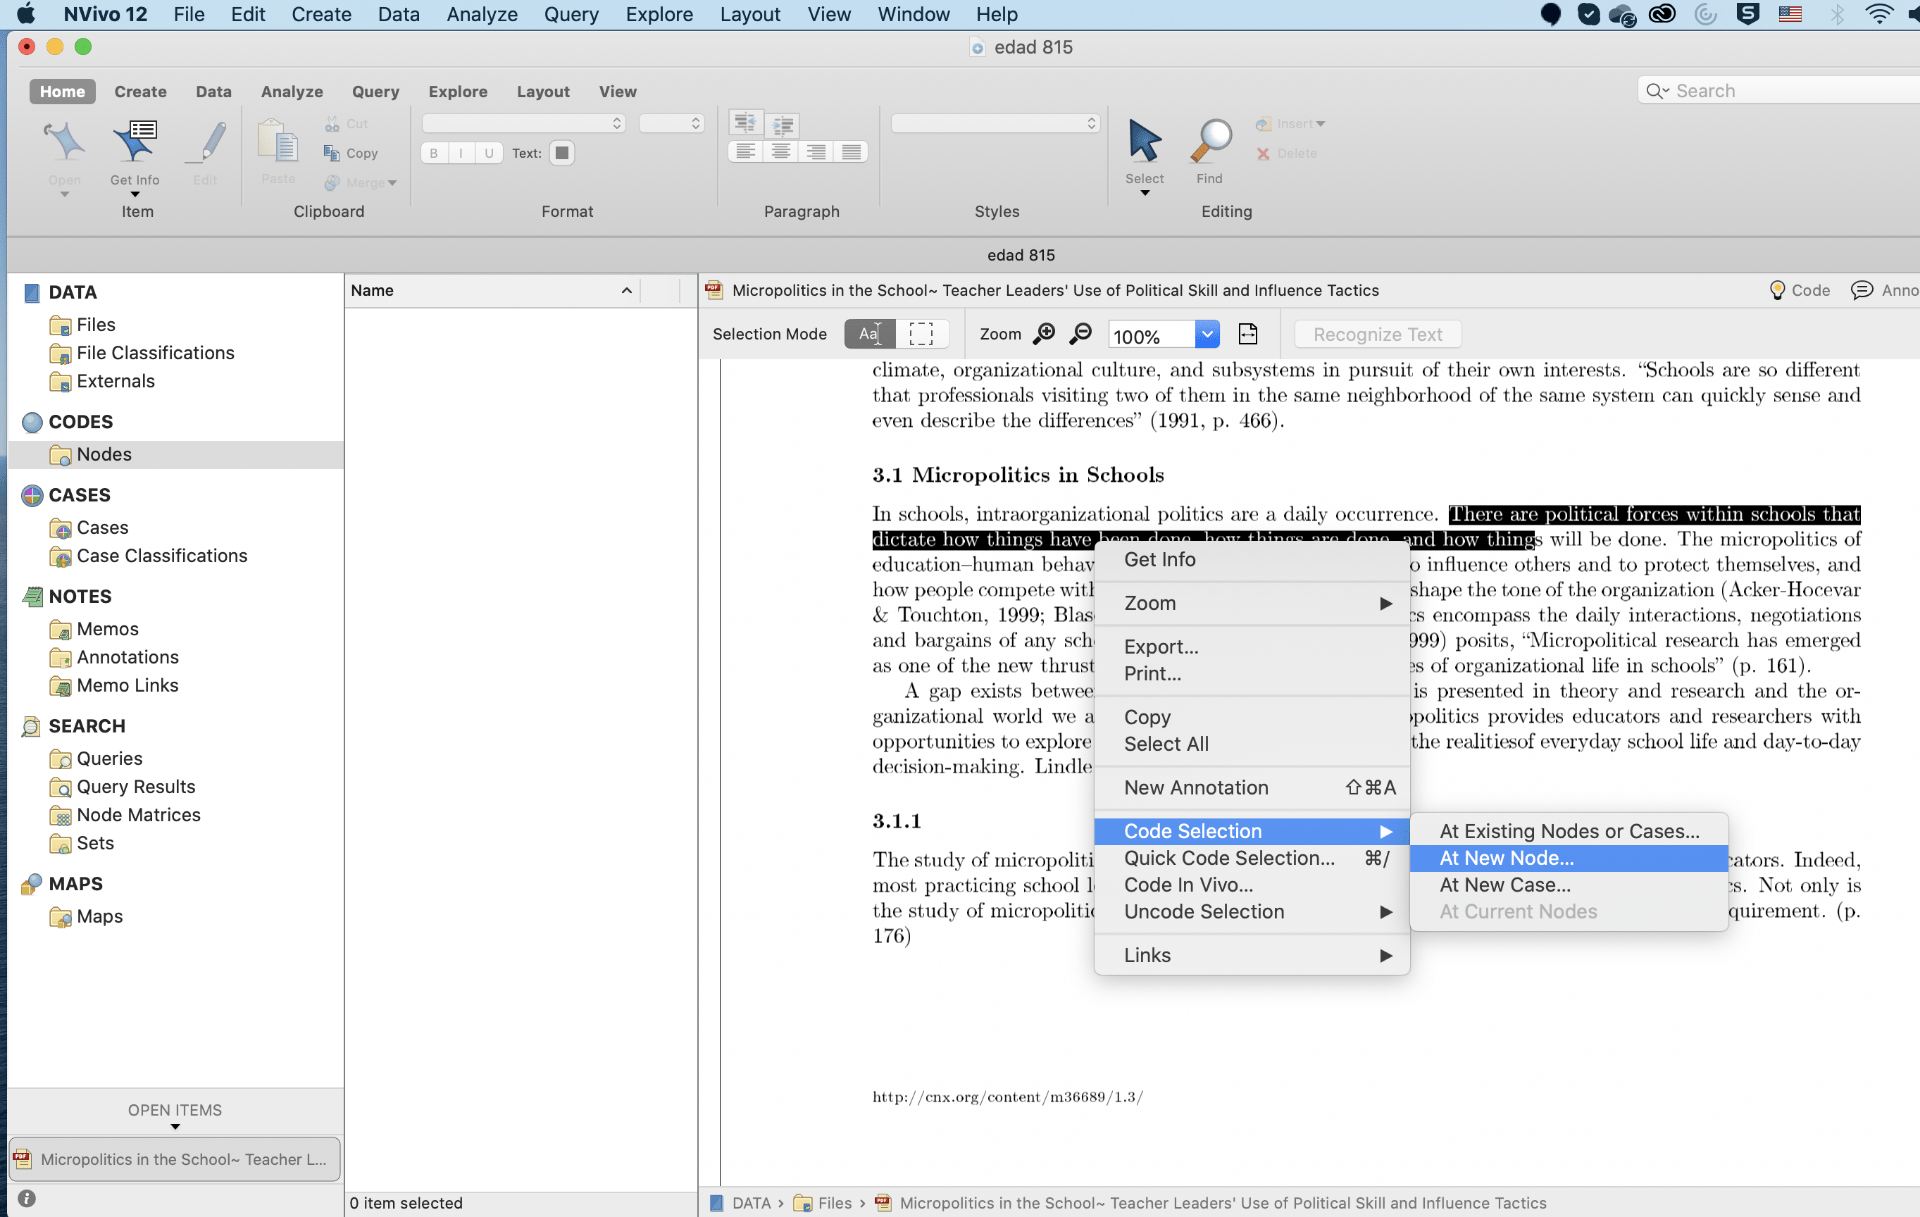
Nvivo allows coding the articles for preparing a literature review. Articles have tremendous amount of text and information in the forms of graphs, more importantly, articles are in the format of PDF. Since Nvivo does not allow editing PDF files, apply manual coding in case of literature review. There are two strategies of coding articles in Nvivo.
Code the text of PDF files into a new Node.
Code the text of PDF file into an existing Node. The procedure of manual coding in literature review is similar to interview transcripts.
The Case Nodes of articles are created as per the author name or year of the publication.
For example: Create a case node with the name of that author and attach all articles in case of multiple articles of same Author in a row with different information. For instance in figure below, five articles of same author’s name, i.e., Mr. Toppings have been selected together to group in a case Node. Prepare case nodes like this then effortlessly search information based on different author’s opinion for writing empirical review in the literature.
Nvivo questions for literature review
Apart from the coding on themes, evidences, authors or opinions in different articles, run different queries based on the aim of the study. Nvivo contains different types of search tools that helps to find information in and across different articles. With the purpose of literature review, this article presents a brief overview of word frequency search, text search, and coding query in Nvivo.
Word frequency
Word frequency in Nvivo allows searching for different words in the articles. In case of literature review, use word frequency to search for a word. This will help to find what different author has stated about the word in the article. Run word frequency on all types of sources and limit the number of words which are not useful to write the literature.
For example, run the command of word frequency with the limit of 100 most frequent words . This will help in assessing if any of these words remotely provide any new information for the literature (figure below).
and
and
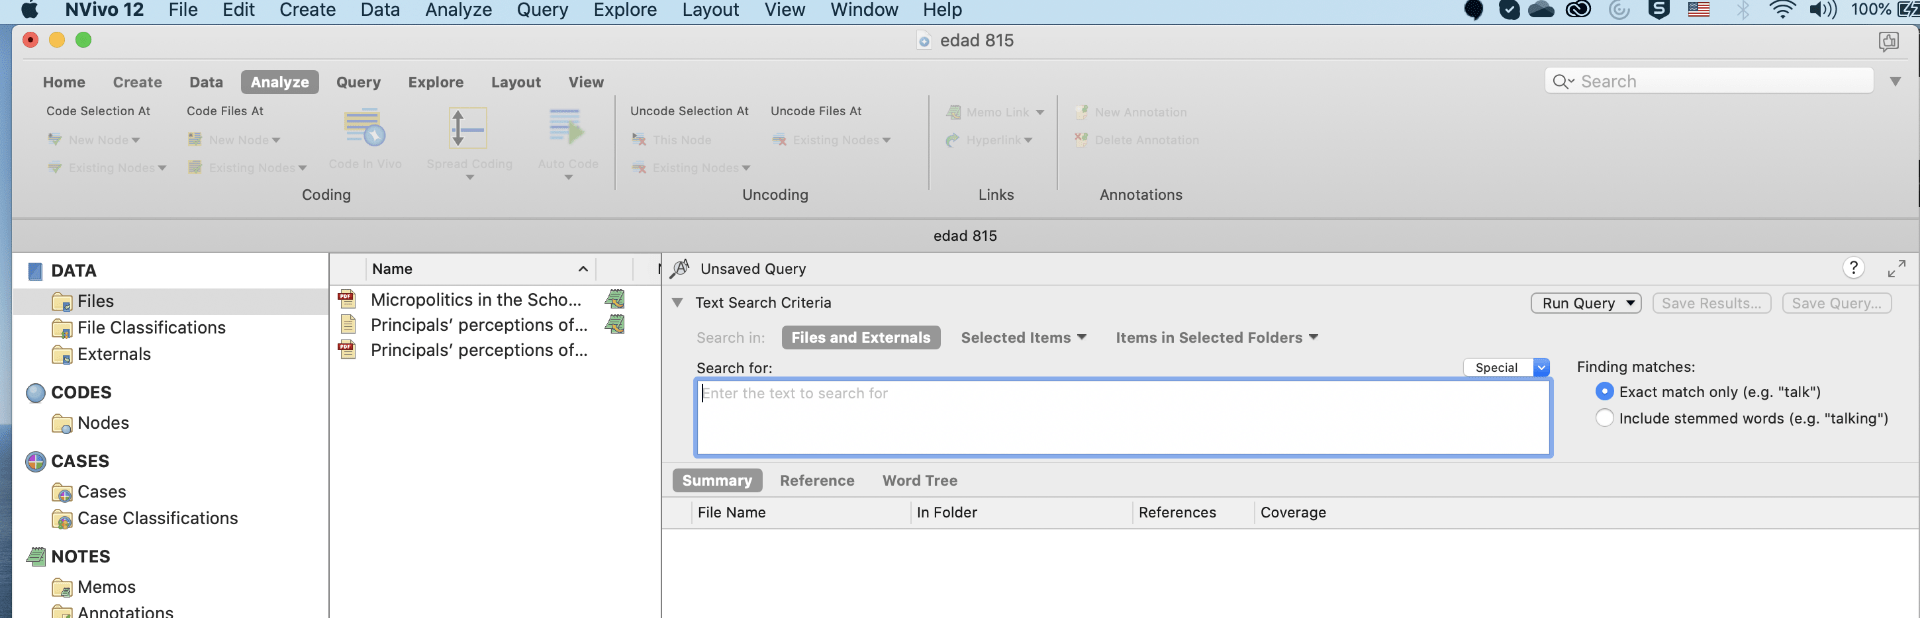
Text search
Text search is more elaborative tool then word frequency search in Nvivo. It allows Nvivo to search for a particular phrase or expression in the articles. Also, Nvivo gives the opportunity to make a node out of text search if a particular word, phrase or expression is found useful for literature.
For example: conduct a text search query to find a word “Scaffolding” in the articles. In this case Nvivo will provide all the words, phrases and expression slightly related to this word across all the articles (Figure 8 & 9). The difference between test search and word frequency lies in generating texts, sentences and phrases in the latter related to the queried word.
Coding query
Apart from text search and word frequency search Nvivo also provides the option of coding query. Coding query helps in literature review to know the intersection between two Nodes. As mentioned previously, nodes contains the information from the articles. Furthermore it is also possible that two nodes contain similar set of information. Therefore, coding query helps to condense this information in the form of two way table which represents the intersection between selected nodes.
For example, in below figure, researcher have search the intersection between three nodes namely, academics, psychological and social on the basis of three attributes namely qantitative, qualitative and mixed research. This coding theory is performed to know which of the selected themes nodes have all types of attributes. Like, Coding Matrix in figure below shows that academic have all three types of attributes that is research (quantitative, qualitative and mixed). Where psychological has only two types of attributes research (quantitative and mixed).
In this way, Coding query helps researchers to generate intersection between two or more theme nodes. This also simplifies the pattern of qualitative data to write literature.
+++++++++++++++++++
Please do not hesitate to contact me with questions, suggestions before, during or after our workshop and about ANY questions and suggestions you may have about your Chapter 2 and, particularly about your literature review:
Many platforms have both qualitative and quantitative capabilities, such as UserZoom and UserTesting
Tips for Remote Facilitating and Presenting:
turn on your camera
Enable connection
Create ground rules
Assign homework
Adapt the structure
Tools for Remote Facilitating and Presenting
Presenting UX work: Zoom, GoToMeeting, and Google Hangouts Meet
Generative workshop activities: Google Draw, Microsoft Visio, Sketch, MURAL, and Miro
Evaluative workshop activities: MURAL or Miro. Alternatively, use survey tools such as SurveyMonkey or CrowdSignal, or live polling apps such as Poll Everywhere that you can insert directly into your slides.
Remote Collaboration and Brainstorming
Consider both synchronous and asynchronous methods
Intro to NVivo – January 31 10:00 a.m. – 12:30 p.m.
440 Blegen Hall
NVivo is a qualitative data management, coding and markup tool, that facilitates powerful querying and exploration of source materials for both mixed methods and qualitative analysis. It integrates well with tools that assist in data collection and can handle a wide variety of source materials. This workshop introduces the basic functions of NVivo, with no prior experience necessary. The session is held in a computer lab with the software already installed. Register.
Overreliance on data to drive design decisions can be just as harmful as ignoring it. Data only tells one kind of story. But your project goals are often more complex than that. Goals can’t always be objectively measured.
Data-driven design is about using information gleaned from both quantitative and qualitative sources to inform how you make decisions for a set of users. Some common tools used to collect data include user surveys, A/B testing, site usage and analytics, consumer research, support logs, and discovery calls.
Designers justified their value through their innate talent for creative ideas and artistic execution. Those whose instincts reliably produced success became rock stars.
In today’s data-driven world, that instinct is less necessary and holds less power. But make no mistake, there’s still a place for it.
Data is good at measuring things that are easy to measure. Some goals are less tangible, but that doesn’t make them less important.
Data has become an authoritarian who has fired the other advisors who may have tempered his ill will. A designer’s instinct would ask, “Do people actually enjoy using this?” or “How do these tactics reflect on our reputation and brand?”
Deciding between two or three options? This is where data shines. Nothing is more decisive than an A/B test to compare potential solutions and see which one actually performs better. Make sure you’re measuring long-term value metrics and not just views and clicks.
Sweating product quality and aesthetics? Turn to your instinct. The overall feeling of quality is a collection of hundreds of micro-decisions, maintained consistency, and execution with accuracy. Each one of those decisions isn’t worth validating on its own. Your users aren’t design experts, so their feedback will be too subjective and variable. Trust your design senses when finessing the details.
Unsure about user behavior? Use data rather than asking for opinions. When asked what they’ll do, customers will do what they think you want them to. Instead, trust what they actually do when they think nobody’s looking.
Building brand and reputation? Data can’t easily measure this. But we all know trustworthiness is as important as clicks (and sometimes they’re opposing goals). When building long-term reputation, trust your instinct to guide you to what’s appealing, even if it sometimes contradicts short-term data trends. You have to play the long game here.
Bedi, S., & Walde, C. (2017). Transforming Roles: Canadian Academic Librarians Embedded in Faculty Research Projects. College & Research Libraries, 78(3), undefined-undefined. https://doi.org/10.5860/crl.78.3.314
As collections become increasingly patron-driven, and libraries share evolving service models, traditional duties such as cataloguing, reference, and collection development are not necessarily core duties of all academic librarians.1
Unlike our American colleagues, many Canadian academic librarians are not required to do research for tenure and promotion; however, there is an expectation among many that they do research, not only for professional development, but to contribute to the profession.
using qualitative inquiry methods to capture the experiences and learning of Canadian academic librarians embedded in collaborative research projects with faculty members.
The term or label “embedded librarian” has been around for some time now and is often used to define librarians who work “outside” the traditional walls of the library. Shumaker,14 who dates the use of the term to the 1970s, defines embedded librarianship as “a distinctive innovation that moves the librarians out of libraries [and] emphasizes the importance of forming a strong working relationship between the librarian and a group or team of people who need the librarian’s information expertise.”15
This model of embedded librarianship has been active on campuses and is most prevalent within professional disciplines like medicine and law. In these models, the embedded librarian facilitates student learning, extending the traditional librarian role of information-literacy instruction to becoming an active participant in the planning, development, and delivery of course-specific or discipline-specific curriculum. The key feature of embedded librarianship is the collaboration that exists between the librarian and the faculty member(s).17
However, with the emergence of the librarian as researcher… More often than not, librarians have had more of a role in the literature-search process with faculty research projects as well as advising on appropriate places for publication.
guiding research question became “In what ways have Canadian academic librarians become embedded in faculty research projects, and how have their roles been transformed by their experience as researchers?”
Rubin and Rubin20 support this claim, noting that qualitative inquiry is a way to learn about the thoughts and feelings of others. Creswell confirms this, stating:
Qualitative research is best suited to address a research problem in which you do not know the variable and need to explore. The literature might yield little information about the phenomenon of study, and you need to learn more from participants through exploration. [Thus] a central phenomenon is the key concept, idea, or process studied in qualitative research.21
eight participants
As Janke and Rush point out, librarians are no longer peripheral in academic research but are now full members of investigative teams.30 But, as our research findings have highlighted, they are making this transition as a result of prior relationships with faculty brought about through traditional liaison work involving collection development, acquisitions, and information-literacy instruction. As our data demonstrates, the extent to which our participants were engaged within all aspects of the research process supports our starting belief that librarians have a vital and important contribution to make in redefining the role of the librarian in higher education.
++++++++++++++++++
Carlson, J., & Kneale, R. (2017). Embedded librarianship in the research context: Navigating new waters. College & Research Libraries News, 72(3), 167–170. https://doi.org/10.5860/crln.72.3.8530
Embedded librarianship takes a librarian out of the context of the traditional
library and places him or her in an “on-site” setting or situation that enables close coordination and collaboration with researchers or teaching faculty
+++++++++++++++++++
Summey, T. P., & Kane, C. A. (2017). Going Where They Are: Intentionally Embedding Librarians in Courses and Measuring the Impact on Student Learning. Journal of Library and Information Services in Distance Learning, 11(1–2), 158–174.
Wu, L., & Thornton, J. (2017). Experience, Challenges, and Opportunities of Being Fully Embedded in a User Group. Medical Reference Services Quarterly, 36(2), 138–149.
Using Social Media for Research – November 16 12:00 – 1:00 p.m.
1314 Social Sciences
Professor Lee-Ann Kastman Breuch (Writing Studies) and Michael Beckstrand (Mixed-Methods Research Associate, LATIS) will discuss how to retrieve, prepare, and analyze social media data for research projects. Using two case studies, Lee-Ann will share examples of a grounded theory analysis of blog, Twitter, and Facebook data. Michael will speak about the technical aspects of retrieving and managing social media data. Pizza will be provided. Learn more and register here.
This event is part of the 2018-19 Research Development Friday Roundtable Series organized by the CLA Research Development Team.
Summary This short paper lays out an attempt to measure how much activity from Russian state-operated accounts released in the dataset made available by Twitter in October 2018 was targeted at the United Kingdom. Finding UK-related Tweets is not an easy task. By applying a combination of geographic inference, keyword analysis and classification by algorithm, we identified UK-related Tweets sent by these accounts and subjected them to further qualitative and quantitative analytic techniques.
We find:
There were three phases in Russian influence operations : under-the-radar account building, minor Brexit vote visibility, and larger-scale visibility during the London terror attacks.
Russian influence operations linked to the UK were most visible when discussing Islam . Tweets discussing Islam over the period of terror attacks between March and June 2017 were retweeted 25 times more often than their other messages.
The most widely-followed and visible troll account, @TEN_GOP, shared 109 Tweets related to the UK. Of these, 60 percent were related to Islam .
The topology of tweet activity underlines the vulnerability of social media users to disinformation in the wake of a tragedy or outrage.
Focus on the UK was a minor part of wider influence operations in this data . Of the nine million Tweets released by Twitter, 3.1 million were in English (34 percent). Of these 3.1 million, we estimate 83 thousand were in some way linked to the UK (2.7%). Those Tweets were shared 222 thousand times. It is plausible we are therefore seeing how the UK was caught up in Russian operations against the US .
Influence operations captured in this data show attempts to falsely amplify other news sources and to take part in conversations around Islam , and rarely show attempts to spread ‘fake news’ or influence at an electoral level.
On 17 October 2018, Twitter released data about 9 million tweets from 3,841 blocked accounts affiliated with the Internet Research Agency (IRA) – a Russian organisation founded in 2013 and based in St Petersburg, accused of using social media platforms to push pro-Kremlin propaganda and influence nation states beyond their borders, as well as being tasked with spreading pro-Kremlin messaging in Russia. It is one of the first major datasets linked to state-operated accounts engaging in influence operations released by a social media platform.
Conclusion
This report outlines the ways in which accounts linked to the Russian Internet ResearchAgency (IRA) carried out influence operations on social media and the ways their operationsintersected with the UK.The UK plays a reasonably small part in the wider context of this data. We see two possibleexplanations: either influence operations were primarily targeted at the US and British Twitterusers were impacted as collate, or this dataset is limited to US-focused operations whereevents in the UK were highlighted in an attempt to impact US public, rather than a concertedeffort against the UK. It is plausible that such efforts al so existed but are not reflected inthis dataset.Nevertheless, the data offers a highly useful window into how Russian influence operationsare carried out, as well as highlighting the moments when we might be most vulnerable tothem.Between 2011 and 2016, these state-operated accounts were camouflaged. Through manualand automated methods, they were able to quietly build up the trappings of an active andwell-followed Twitter account before eventually pivoting into attempts to influence the widerTwitter ecosystem. Their methods included engaging in unrelated and innocuous topics ofconversation, often through automated methods, and through sharing and engaging withother, more mainstream sources of news.Although this data shows levels of electoral and party-political influence operations to berelatively low, the day of the Brexit referendum results showed how messaging originatingfrom Russian state-controlled accounts might come to be visible – on June 24th 2016, we believe UK Twitter users discussing the Brexit Vote would have encountered messages originating from these accounts.As early as 2014, however, influence operations began taking part in conversations aroundIslam, and these accounts came to the fore during the three months of terror attacks thattook place between March and June 2017. In the immediate wake of these attacks, messagesrelated to Islam and circulated by Russian state-operated Twitter accounts were widelyshared, and would likely have been visible in the UK.The dataset released by Twitter begins to answer some questions about attempts by a foreignstate to interfere in British affairs online. It is notable that overt political or electoralinterference is poorly represented in this dataset: rather, we see attempts at stirring societaldivision, particularly around Islam in the UK, as the messages that resonated the most overthe period.What is perhaps most interesting about this moment is its portrayal of when we as socialmedia users are most vulnerable to the kinds of messages circulated by those looking toinfluence us. In the immediate aftermath of terror attacks, the data suggests, social mediausers were more receptive to this kind of messaging than at any other time.
It is clear that hostile states have identified the growth of online news and social media as aweak spot, and that significant effort has gone into attempting to exploit new media toinfluence its users. Understanding the ways in which these platforms have been used tospread division is an important first step to fighting it.Nevertheless, it is clear that this dataset provides just one window into the ways in whichforeign states have attempted to use online platforms as part of wider information warfare
and influence campaigns. We hope that other platforms will follow Twitter’s lead and release
similar datasets and encourage their users to proactively tackle those who would abuse theirplatforms.
“Netnography” has been developed for online community researchers. It is “net” plus “ethnography,” which is based on the traditional ethnography and combines with the qualitative analysis for online interactive contents forms of virtual community members. The aim of doing netnographic research is to study the subculture, interactive process and characteristics of collective behaviors of online communities (Kozinets 2009). Follow the development of Internet technology, the web–based method is more convenient and cost–effect in data collection. Members in virtual groups create a large number of interactive texts, pictures, network expressions and other original information over time, which provides an extremely rich database to researchers. Moreover, from the data collection’s point of view, this online observation method will not interfere with the whole research process, which is better than questionnaires and quantitative modeling (Moisander and Valtonen 2006). Additionally, Kozinets (2009) also pointed that netnogrpahy emphasize on the research background, observers not only focus on the text during communications but also need to pay attention to the characteristics of language, history, meaning and communication types. Even parse fonts, symbols, images and photo data. These content of studies are significant in social communication, which is called “Cultural Artifact.” On the other hand, netnography is based on traditional ethnography as a methodology; therefore it inherits the research processes of ethnographic method. Kozients (2009) reinterpreted these procedures for netnography as Firstly, to determine the research target and understand its cultural characteristics; Secondly, to collect and analyze information; Thirdly, to ensure the credibility of interpretation; Fourthly, pay attention to research ethics; Lastly, to obtain respondents feedbacks. To make my research adapting to this guidelines, I make my research process as 1. To target on Plymouth Chinese overseas students and to explain the Chinese guanxi; 2. To collect and analyze data through the existing WeChat group created by Plymouth Chinese Students and Scholars Association (CSSA); 3. To confirm the identity of key influencers in this virtual group; 4. To get feedbacks from respondent as much as possible.
Ungerer, L. M. (2016). Digital Curation as a Core Competency in Current Learning and Literacy: A Higher Education Perspective. The International Review of Research in Open and Distributed Learning, 17(5). https://doi.org/10.19173/irrodl.v17i5.2566
Dunaway (2011) suggests that learning landscapes in a digital age are networked, social, and technological. Since people commonly create and share information by collecting, filtering, and customizing digital content, educators should provide students opportunities to master these skills (Mills, 2013). In enhancing critical thinking, we have to investigate pedagogical models that consider students’ digital realities (Mihailidis & Cohen, 2013). November (as cited in Sharma & Deschaine, 2016), however warns that although the Web fulfils a pivotal role in societal media, students often are not guided on how to critically deal with the information that they access on the Web. Sharma and Deschaine (2016) further point out the potential for personalizing teaching and incorporating authentic material when educators themselves digitally curate resources by means of Web 2.0 tools.
p. 24. Communities of practice. Lave and Wenger’s (as cited in Weller, 2011) concept of situated learning and Wenger’s (as cited in Weller, 2011) idea of communities of practice highlight the importance of apprenticeship and the social role in learning.
criteria to publish a paper
Originality: Does the paper contain new and significant information adequate to justify publication?
Relationship to Literature: Does the paper demonstrate an adequate understanding of the relevant literature in the field and cite an appropriate range of literature sources? Is any significant work ignored?
Methodology: Is the paper’s argument built on an appropriate base of theory, concepts, or other ideas? Has the research or equivalent intellectual work on which the paper is based been well designed? Are the methods employed appropriate?
Results: Are results presented clearly and analyzed appropriately? Do the conclusions adequately tie together the other elements of the paper?
Implications for research, practice and/or society: Does the paper identify clearly any implications for research, practice and/or society? Does the paper bridge the gap between theory and practice? How can the research be used in practice (economic and commercial impact), in teaching, to influence public policy, in research (contributing to the body of knowledge)? What is the impact upon society (influencing public attitudes, affecting quality of life)? Are these implications consistent with the findings and conclusions of the paper?
Quality of Communication: Does the paper clearly express its case, measured against the technical language of the field and the expected knowledge of the journal’s readership? Has attention been paid to the clarity of expression and readability, such as sentence structure, jargon use, acronyms, etc.
Stanton, K. V., & Liew, C. L. (2011). Open Access Theses in Institutional Repositories: An Exploratory Study of the Perceptions of Doctoral Students. Information Research: An International Electronic Journal, 16(4),
We examine doctoral students’ awareness of and attitudes to open access forms of publication. Levels of awareness of open access and the concept of institutional repositories, publishing behaviour and perceptions of benefits and risks of open access publishing were explored. Method: Qualitative and quantitative data were collected through interviews with eight doctoral students enrolled in a range of disciplines in a New Zealand university and a self-completion Web survey of 251 students. Analysis: Interview data were analysed thematically, then evaluated against a theoretical framework. The interview data were then used to inform the design of the survey tool. Survey responses were analysed as a single set, then by disciple using SurveyMonkey’s online toolkit and Excel. Results: While awareness of open access and repository archiving is still low, the majority of interview and survey respondents were found to be supportive of the concept of open access. The perceived benefits of enhanced exposure and potential for sharing outweigh the perceived risks. The majority of respondents were supportive of an existing mandatory thesis submission policy. Conclusions: Low levels of awareness of the university repository remains an issue, and could be addressed by further investigating the effectiveness of different communication channels for promotion.
PLEASE NOTE:
the researchers use the qualitative approach: by interviewing participants and analyzing their responses thematically, they build the survey.
Then then administer the survey (the quantitative approach)
How do you intend to use a mixed method? Please share
Metaphors: A Problem Statement is like… metaphor — a novel or poetic linguistic expression where one or more words for a concept are used outside normal conventional meaning to express a similar concept. Aristotle l The DNA of the research l A snapshot of the research l The foundation of the research l The Heart of the research l A “taste” of the research l A blueprint for the study
digital object identifier (DOI) is a unique alphanumeric string assigned by a registration agency (the International DOI Foundation) to identify content and provide a persistent link to its location on the Internet. The publisher assigns a DOI when your article is published and made available electronically.
Why do we need it?
2010 Changes to APA for Electronic Materials Digital object identifier (DOI). DOI available. If a DOI is available you no longer include a URL. Example: Author, A. A. (date). Title of article. Title of Journal, volume(number), page numbers. doi: xx.xxxxxxx
Accodring to Sugimoto et al (2016), the Use of social media platforms for by researchers is high — ranging from 75 to 80% in large -scale surveys (Rowlands et al., 2011; Tenopir et al., 2013; Van Eperen & Marincola, 2011) .
There is one more reason, and, as much as you want to dwell on the fact that you are practitioners and research is not the most important part of your job, to a great degree, you may be judged also by the scientific output of your office and/or institution.
In that sense, both social media and altimetrics might suddenly become extremely important to understand and apply.
Shortly altmetrics (alternative metrics) measure the impact your scientific output has on the community. Your teachers and you present, publish and create work, which might not be presented and published, but may be widely reflected through, e.g. social media, and thus, having impact on the community.
How such impact is measured, if measured at all, can greatly influence the money flow to your institution
For EVEN MORE information, read the entire article:
Sugimoto, C. R., Work, S., Larivière, V., & Haustein, S. (2016). Scholarly use of social media and altmetrics: a review of the literature. Retrieved from https://arxiv.org/abs/1608.08112
Thelwall, M., & Wilson, P. (2016). Mendeley readership altmetrics for medical articles: An analysis of 45 fields. Journal of the Association for Information Science and Technology, 67(8), 1962–1972. https://doi.org/10.1002/asi.23501
Todd Tetzlaff is using Mendeley and he might be the only one to benefit … 🙂
Here is some food for thought from the article above:
Doctoral students and junior researchers are the largest reader group in Mendeley ( Haustein & Larivière, 2014; Jeng et al., 2015; Zahedi, Costas, & Wouters, 2014a) .
Studies have also provided evidence of high rate s of blogging among certain subpopulations: for example, approximately one -third of German university staff (Pscheida et al., 2013) and one fifth of UK doctoral students use blogs (Carpenter et al., 2012) .
Social data sharing platforms provide an infrastructure to share various types of scholarly objects —including datasets, software code, figures, presentation slides and videos —and for users to interact with these objects (e.g., comment on, favorite, like , and reuse ). Platforms such as Figshare and SlideShare disseminate scholars’ various types of research outputs such as datasets, figures, infographics, documents, videos, posters , or presentation slides (Enis, 2013) and displays views, likes, and shares by other users (Mas -Bleda et al., 2014) .
Frequently mentioned social platforms in scholarly communication research include research -specific tools such as Mendeley, Zotero, CiteULike, BibSonomy, and Connotea (now defunct) as well as general tools such as Delicious and Digg (Hammond, Hannay, Lund, & Scott, 2005; Hull, Pettifer, & Kell, 2008; Priem & Hemminger, 2010; Reher & Haustein, 2010) .
qualitative research
“The focus group interviews were analysed based on the principles of interpretative phenomenology”
if you are not podcast fans, I understand. The link above is a pain in the behind to make work, if you are not familiar with using podcast.
Here is an easier way to find it:
1. open your cell phone and go find the podcast icon, which is pre-installed, but you might have not ever used it [yet].
2. In the app, use the search option and type “stuff you should know”
3. the podcast will pop up. scroll and find “How the scientific method works,” and/or search for it if you can.
Once you can play it on the phone, you have to find time to listen to it.
I listen to podcast when i have to do unpleasant chores such as: 1. walking to work 2. washing the dishes 3. flying long hours (very rarely). 4. Driving in the car.
There are bunch of other situations, when you may be strapped and instead of filling disgruntled and stressed, you can deliver the mental [junk] food for your brain.
Earbuds help me: 1. forget the unpleasant task, 2. Utilize time 3. Learn cool stuff
Here are podcasts, I am subscribed for, besides “stuff you should know”:
TED Radio Hour
TED Talks Education
NPR Fresh Air
BBC History
and bunch others, which, if i don’t go a listen for an year, i go and erase and if i peruse through the top chart and something picks my interest, I try.
If I did not manage to convince to podcast, totally fine; do not feel obligated.
However, this podcast, you can listen to on your computer, if you don’t want to download on your phone.
It is one hour show by two geeks, who are trying to make funny (and they do) a dry matter such as quantitative vs qualitative, which you want to internalize:
1. Sometimes at minute 12, they talk about inductive versus deductive to introduce you to qualitative versus quantitative. It is good to listen to their musings, since your dissertation is going through inductive and deductive process, and understanding it, can help you control better your dissertation writing.
2. Scientific method. Hypothesis etc (around min 17).
While this is not a Ph.D., but Ed.D. and we do not delve into the philosophy of science and dissertation etc. the more you know about this process, the better control you have over your dissertation.
3. Methods and how you prove (Chapter 3) is discussed around min 35
4. dependent and independent variables and how do you do your research in general (min ~45)
Shortly, listen and please do share your thoughts below. You do not have to be kind to this source offering. Actually, be as critical as possible, so you can help me decide, if I should offer it to the next cohort and thank you in advance for your feedback.