Part of the Debates in the Digital Humanities Series A book series from the University of Minnesota Press Matthew K. Gold and Lauren F. Klein, Series Editors
Defintion
Critical infrastructure studies has emerged as a framework for linking thought on the complex relations between society and its material structures across fields such as science and technology studies, design, ethnography, media infrastructure studies, feminist theory, critical race and ethnicity studies, postcolonial studies, environmental studies, animal studies, literary studies, the creative arts, and others (see the CIstudies.org Bibliography )
An informal consensus seems to have emerged that if students in the humanities are going to make use of quantitative methods, they should probably first learn to program. Introductions to this dimension of the field are organized around programming languages: The Programming Historian is built around an introduction to Python; Matthew Jockers’s Text Analysis with R is at its heart a tutorial in the R language; Taylor Arnold and Lauren Tilton’s Humanities Data in R begins with chapters on the language; Folgert Karsdorp’s Python Programming for the Humanities is a course in the language with examples from stylometry and information retrieval.[11] “On the basis of programming,” writes Moretti in “Literature, Measured,” a recent retrospective on the work of his Literary Lab, “much more becomes possible”
programming competence is not equivalent to competence in analytical methods. It might allow students to prepare data for some future analysis and to produce visual, tabular, numerical, or even interactive summaries; Humanities Data in R gives a fuller survey of the possibilities of exploratory data analysis than the other texts.[15]Yet students who have focused on programming will have to rely on their intuition when it comes to interpreting exploratory results. Intuition gives only a weak basis for arguing about whether apparent trends, groupings, or principles of variation are supported by the data.
From Humanities to Scholarship: Librarians, Labor, and the Digital
First hired as a “digital humanities librarian,” I saw my title changed within less than a year to “digital scholarship librarian,” with a subject specialty later appended (American History). Some three-plus years later at a different institution, I now find myself a digital-less “religion and theology librarian.” At the same time, in this position, my experience and expertise in digital humanities (or “digital scholarship”) are assumed, and any associated duties are already baked into the job description itself.
Jonathan Senchyne has written about the need to reimagine library and information science graduate education and develop its capacity to recognize, accommodate, and help train future library-based digital humanists in both computational research methods and discipline-focused humanities content (368–76). However, less attention has been paid to tracking where these digital humanities and digital scholarship librarians come from, the consequences and opportunities that arise from sourcing librarians from multiple professional and educational stations, and the more ontological issues associated with the nature of their labor—that is, what is understood as work for the digital humanist in the library and what librarians could be doing.
small qualitative studies are almost always critiqued for lack of generalizability. it is less common to critique huge quantitative studies for loss of nuance and richness. and that tells you quite a lot about what kinds of knowledge we value.
The assessment industry is not known for self-critical reflection. Assessors insist that faculty provide evidence that their teaching is effective, but they are dismissive of evidence that their own work is ineffective. They demand data, but they are indifferent to the quality of those data. So it’s not a surprise that the assessment project is built on an unexamined assumption: that learning, especially higher-order learning such as critical thinking, is central to the college experience.
the Lumina Foundation’s Degree Qualifications Profile “provides a qualitative set of important learning outcomes, not quantitative measures such as numbers of credits and grade-point averages, as the basis for awarding degrees.”
article in Change, Daniel Sullivan, president emeritus of St. Lawrence University and a senior fellow at the Association of American Colleges & Universities, and Kate McConnell, assistant vice president for research and assessment at the association, describe a project that looked at nearly 3,000 pieces of student work from 14 institutions. They used the critical-thinking and written-communication Value rubrics designed by the AAC&U to score the work. They discovered that most college-student work falls in the middle of the rubric’s four-point scale measuring skill attainment.
Richard Arum and Josipa Roska’s 2011 book, Academically Adrift, used data from the Collegiate Learning Assessment to show that a large percentage of students don’t improve their critical thinking or writing. A 2017 study by The Wall Street Journal used data from the CLA at dozens of public colleges and concluded that the evidence for learning between the first and senior years was so scant that they called it “discouraging.”
not suggesting that college is a waste of time or that there is no value in a college education. But before we spend scarce resources and time trying to assess and enhance student learning, shouldn’t we maybe check to be sure that learning is what actually happens in college?
Bibliographical data analysis with Zotero and nVivo
Bibliographic Analysis for Graduate Students, EDAD 518, Fri/Sat, May 15/16, 2020
This session will not be about qualitative research (QR) only, but rather about a modern 21st century approach toward the analysis of your literature review in Chapter 2.
However, the computational approach toward qualitative research is not much different than computational approach for your quantitative research; you need to be versed in each of them, thus familiarity with nVivo for qualitative research and with SPSS for quantitative research should be pursued by any doctoral student.
Once you complete the overview of the resources above, please make sure you have Zotero working on your computer; we will be reviewing the Zotero features before we move to nVivo.
Familiarity with Zotero is a prerequisite for successful work with nVivo, so please if you are already working with Zotero, try to expand your knowledge using the materials above.
Please use this link to install nVivo on your computer. Even if we were not in a quarantine and you would have been able to use the licensed nVivo software on campus, for convenience (working on your dissertation from home), most probably, you would have used the shareware. Shareware is fully functional on your computer for 14 days, so calculate the time you will be using it and mind the date of installation and your consequent work.
For the purpose of this workshop, please install nVivo on your computer early morning on Saturday, May 16, so we can work together on nVivo during the day and you can continue using the software for the next two weeks.
Please familiarize yourself with the two articles assigned in the EDAD 815 D2L course content “Practice Research Articles“ :
Brosky, D. (2011). Micropolitics in the School: Teacher Leaders’ Use of Political Skill and Influence Tactics. International Journal of Educational Leadership Preparation, 6(1). https://eric.ed.gov/?id=EJ972880
Tooms, A. K., Kretovics, M. A., & Smialek, C. A. (2007). Principals’ perceptions of politics. International Journal of Leadership in Education, 10(1), 89–100. https://doi.org/10.1080/13603120600950901
It is very important to be familiar with the articles when we start working with nVivo.
whereas the snapshots are replaced with snapshots from nVivol, version 12, which we will be using in our course and for our dissertations.
Concept of bibliographic data
Bibliographic Data is an organized collection of references to publish in literature that includes journals, magazine articles, newspaper articles, conference proceedings, reports, government and legal publications. The bibliographical data is important for writing the literature review of a research. This data is usually saved and organized in databases like Mendeley or Endnote. Nvivo provides the option to import bibliographical data from these databases directly. One can import End Note library or Mendeley library into Nvivo. Similar to interview transcripts, one can represent and analyze bibliographical data using Nvivo. To start with bibliographical data representation, this article previews the processing of literature review in Nvivo.
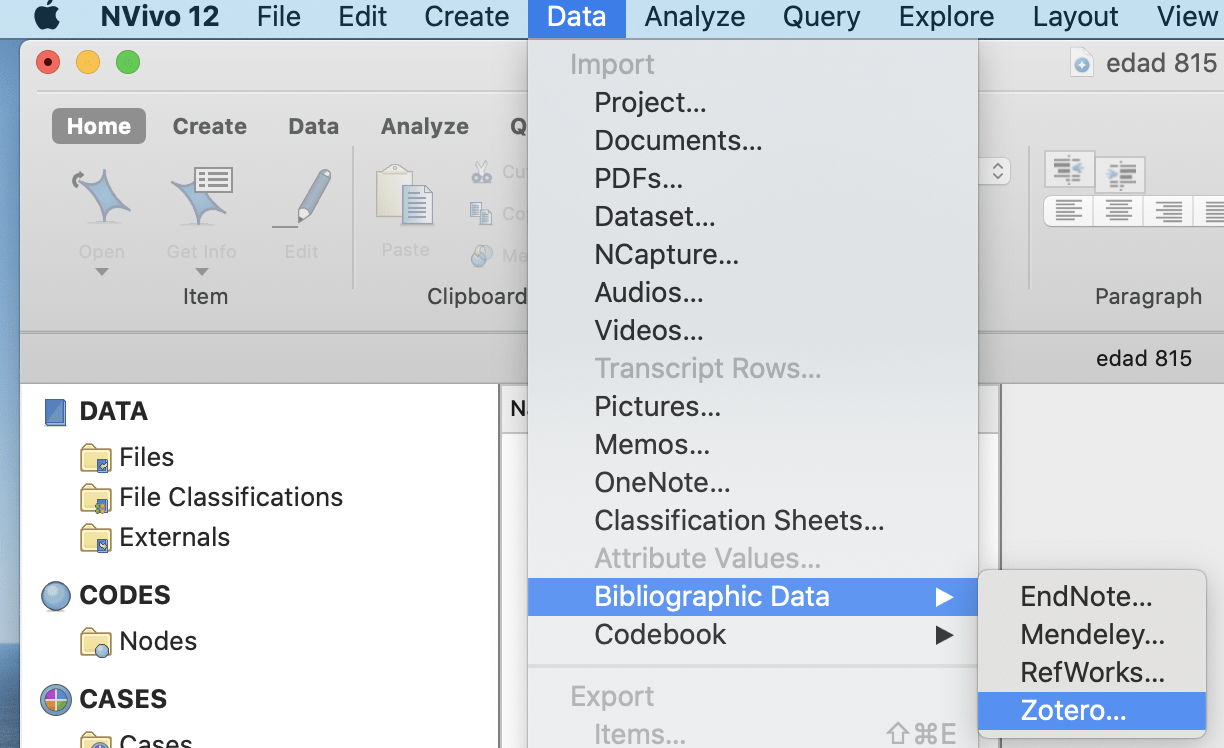
Importing bibliographical data
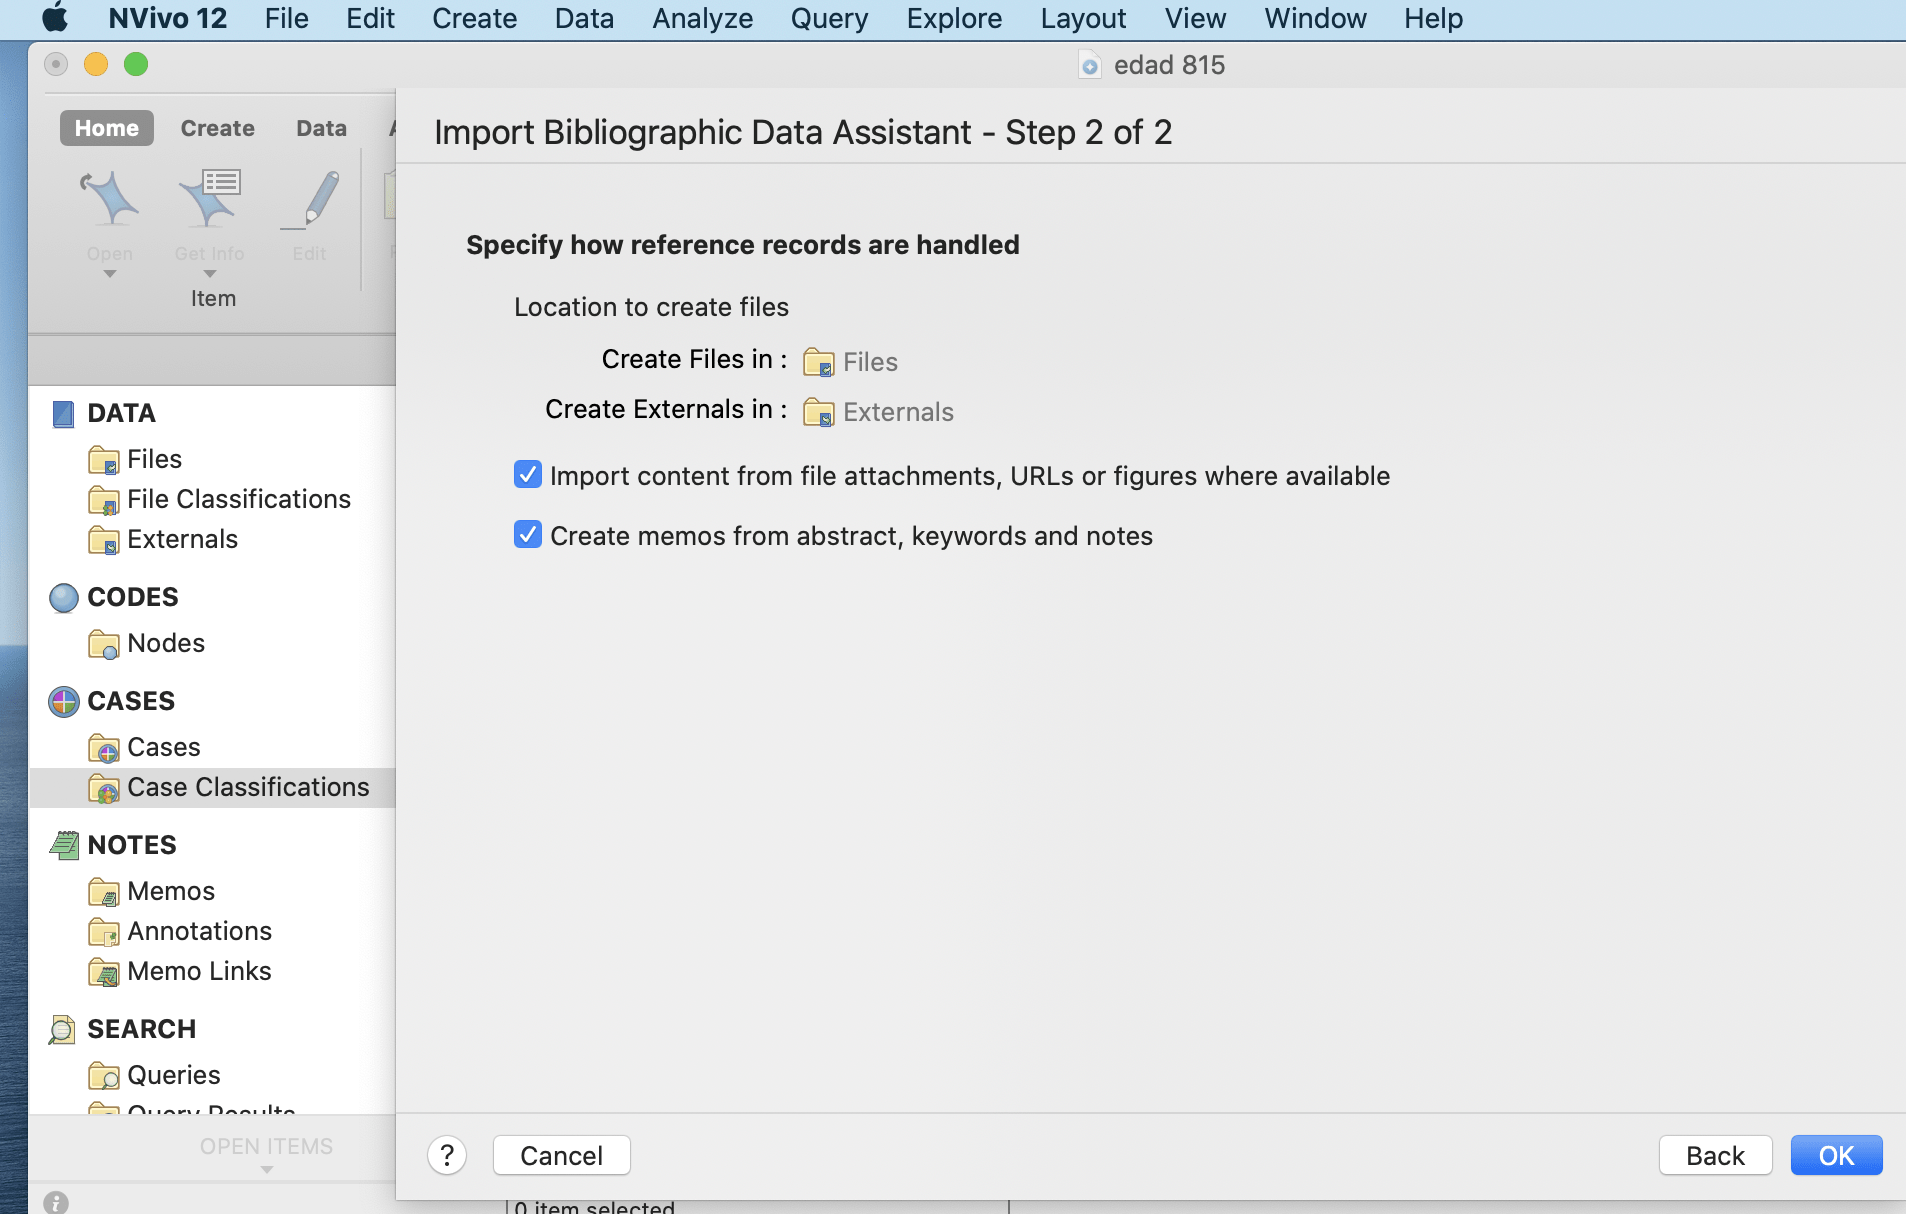
Bibliographic Data is imported using Mendeley, Endnote and other such databases or applications that are supported with Nvivo. Bibliographical data here refers to material in the form of articles, journals or conference proceedings. Common factors among all of these data are the author’s name and year of publication. Therefore, Nvivo helps to import and arrange these data with their titles as author’s name and year of publication. The process of importing bibliographical data is presented in the figures below.
select the appropriate data from external folder
Coding strategies for literature review
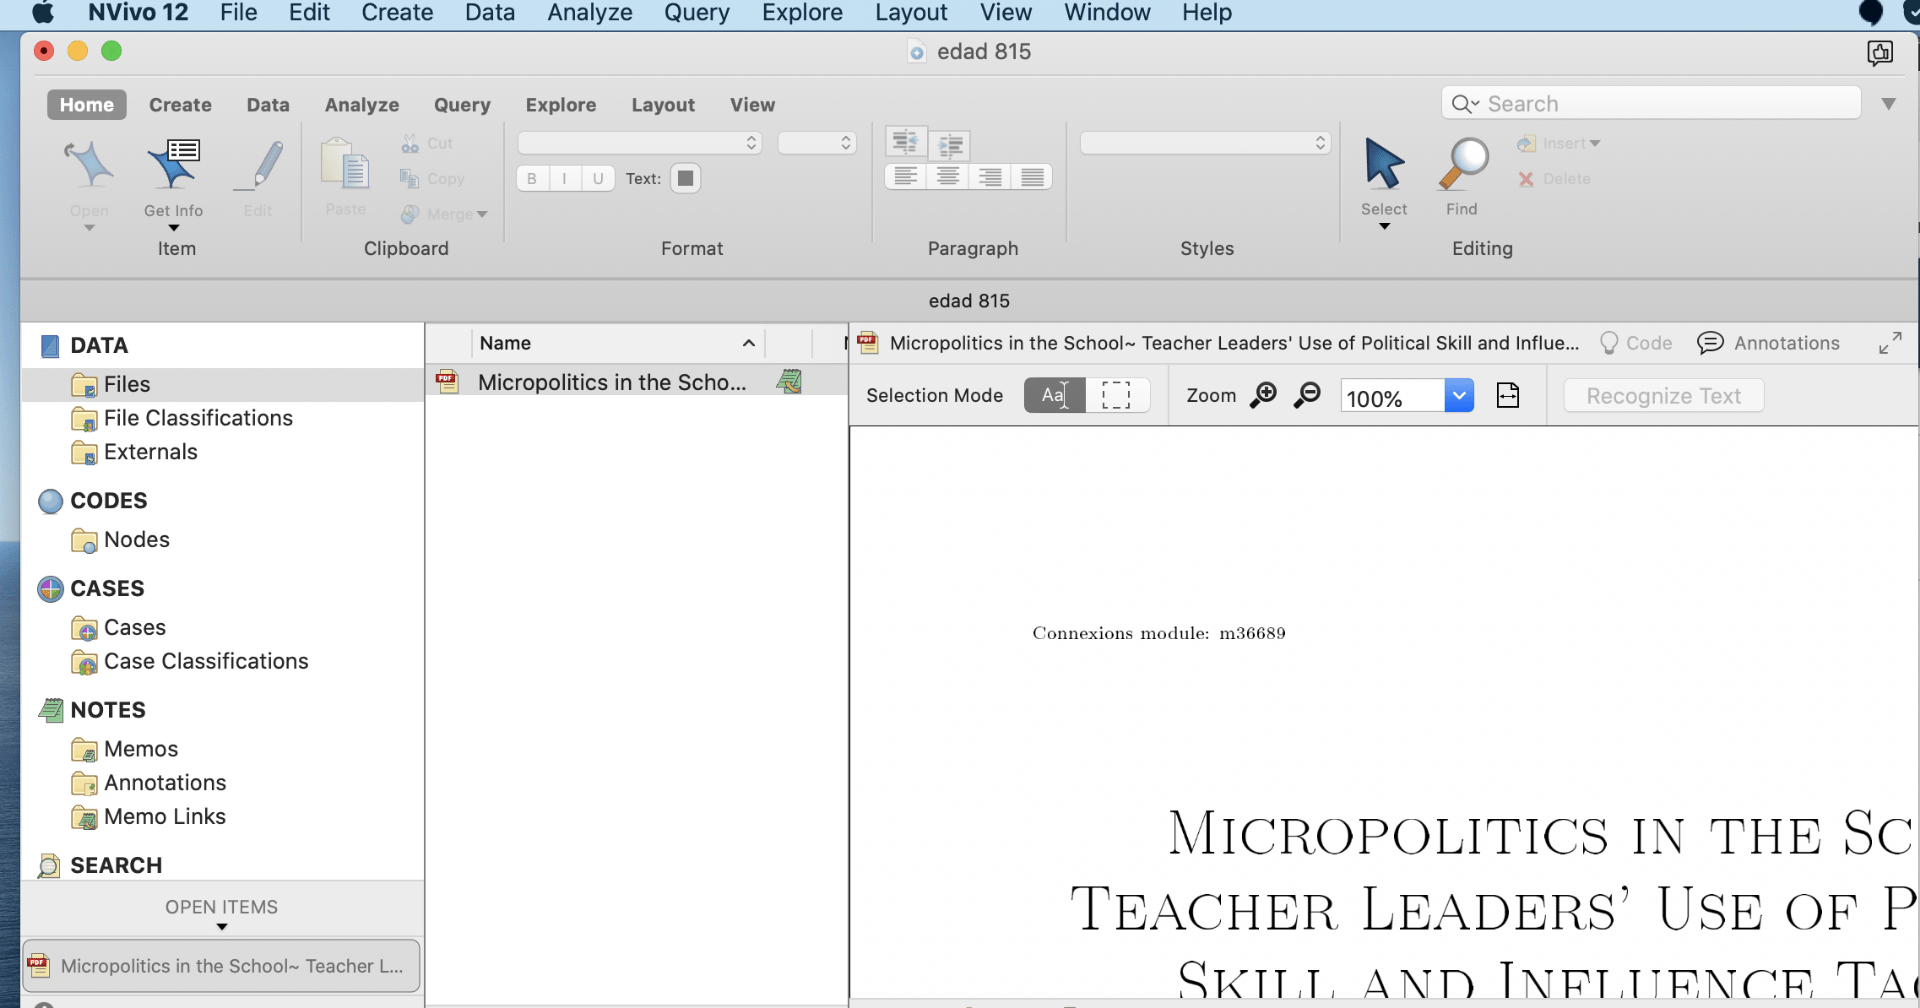
Coding is a process of identifying important parts or patterns in the sources and organizing them in theme node. Sources in case of literature review include material in the form of PDF. That means literature review in Nvivo requires grouping of information from PDF files in the forms of theme nodes. Nodes directly do not create content for literature review, they present ideas simply to help in framing a literature review. Nodes can be created on the basis of theme of the study, results of the study, major findings of the study or any other important information of the study. After creating nodes, code the information of each of the articles into its respective codes.
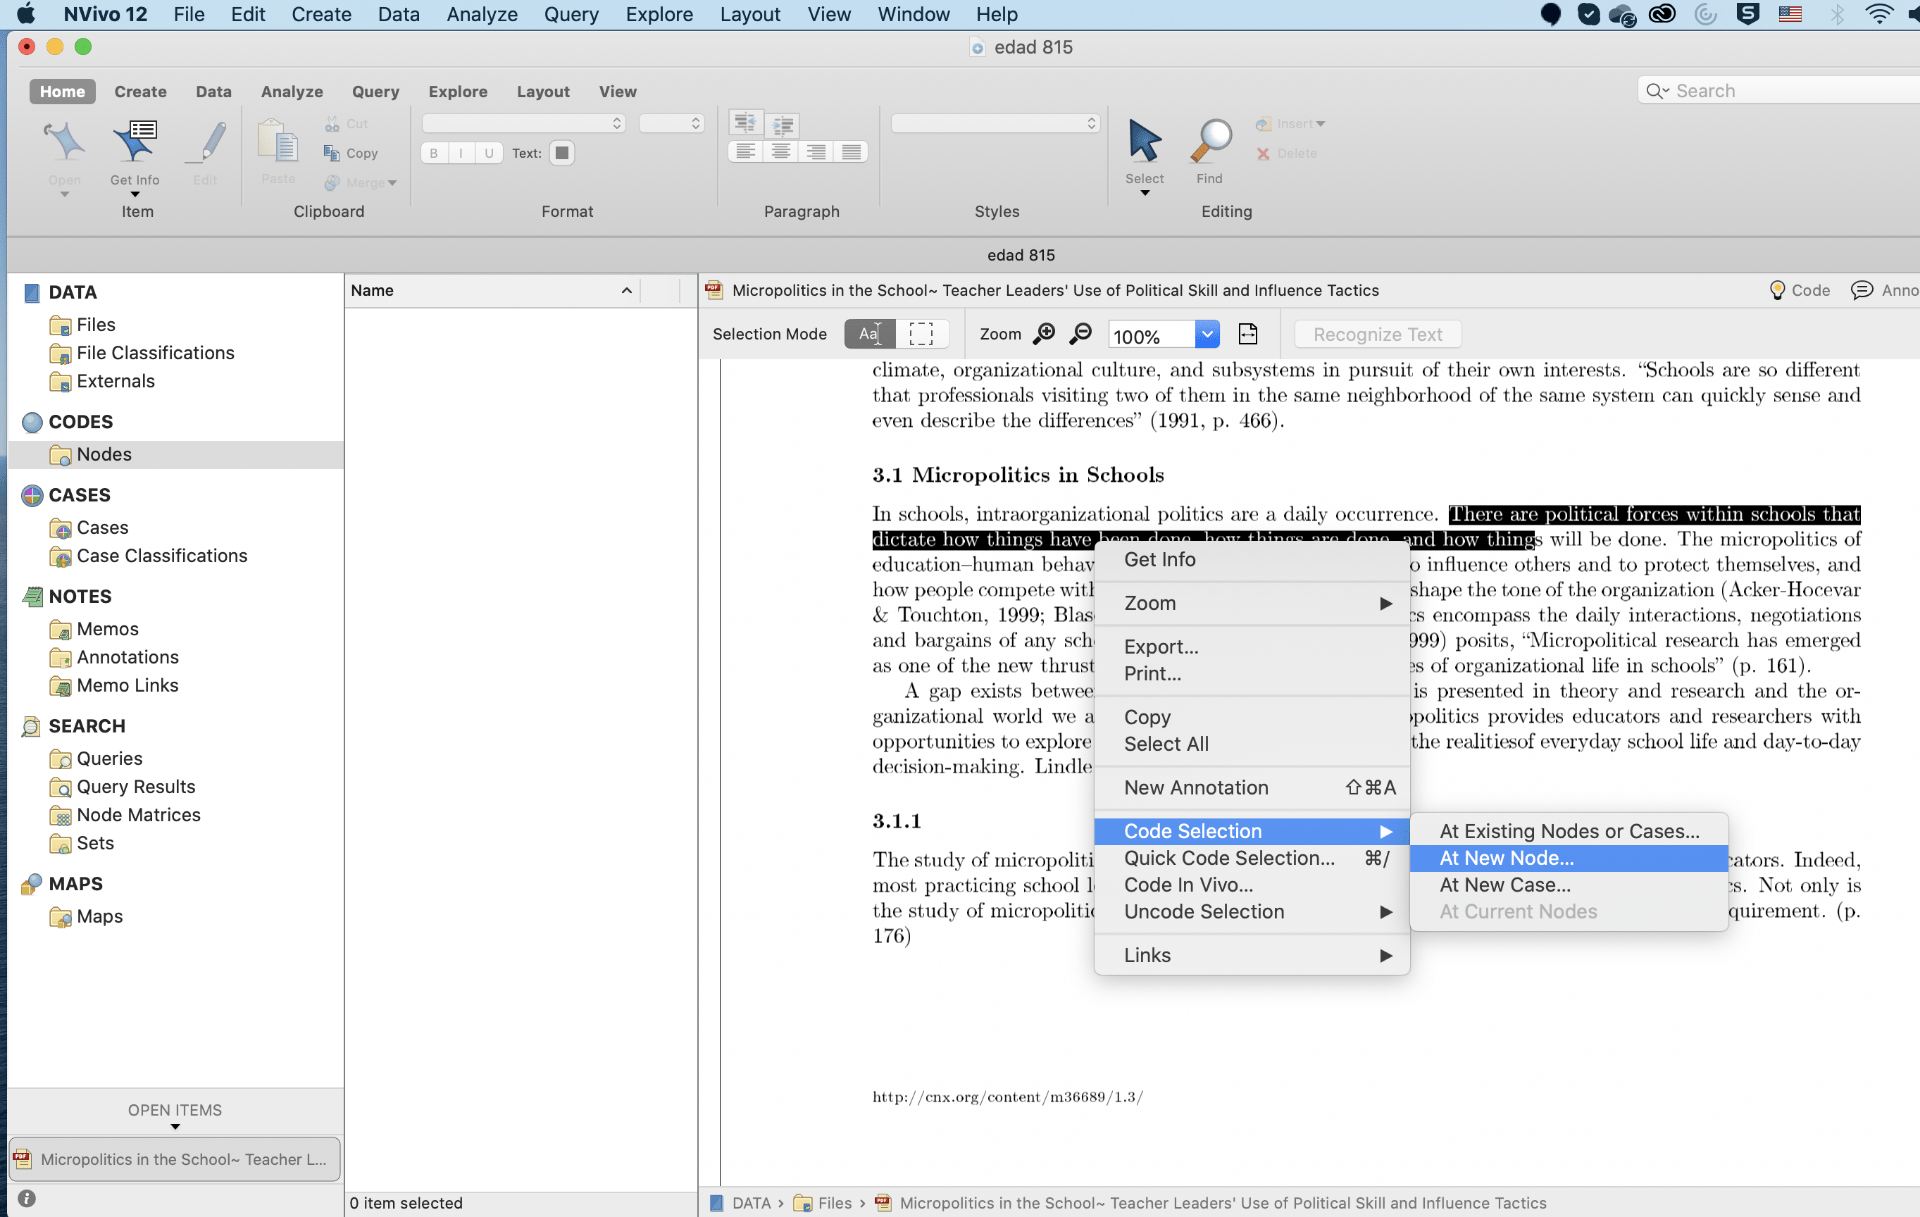
Nvivo allows coding the articles for preparing a literature review. Articles have tremendous amount of text and information in the forms of graphs, more importantly, articles are in the format of PDF. Since Nvivo does not allow editing PDF files, apply manual coding in case of literature review. There are two strategies of coding articles in Nvivo.
Code the text of PDF files into a new Node.
Code the text of PDF file into an existing Node. The procedure of manual coding in literature review is similar to interview transcripts.
The Case Nodes of articles are created as per the author name or year of the publication.
For example: Create a case node with the name of that author and attach all articles in case of multiple articles of same Author in a row with different information. For instance in figure below, five articles of same author’s name, i.e., Mr. Toppings have been selected together to group in a case Node. Prepare case nodes like this then effortlessly search information based on different author’s opinion for writing empirical review in the literature.
Nvivo questions for literature review
Apart from the coding on themes, evidences, authors or opinions in different articles, run different queries based on the aim of the study. Nvivo contains different types of search tools that helps to find information in and across different articles. With the purpose of literature review, this article presents a brief overview of word frequency search, text search, and coding query in Nvivo.
Word frequency
Word frequency in Nvivo allows searching for different words in the articles. In case of literature review, use word frequency to search for a word. This will help to find what different author has stated about the word in the article. Run word frequency on all types of sources and limit the number of words which are not useful to write the literature.
For example, run the command of word frequency with the limit of 100 most frequent words . This will help in assessing if any of these words remotely provide any new information for the literature (figure below).
and
and
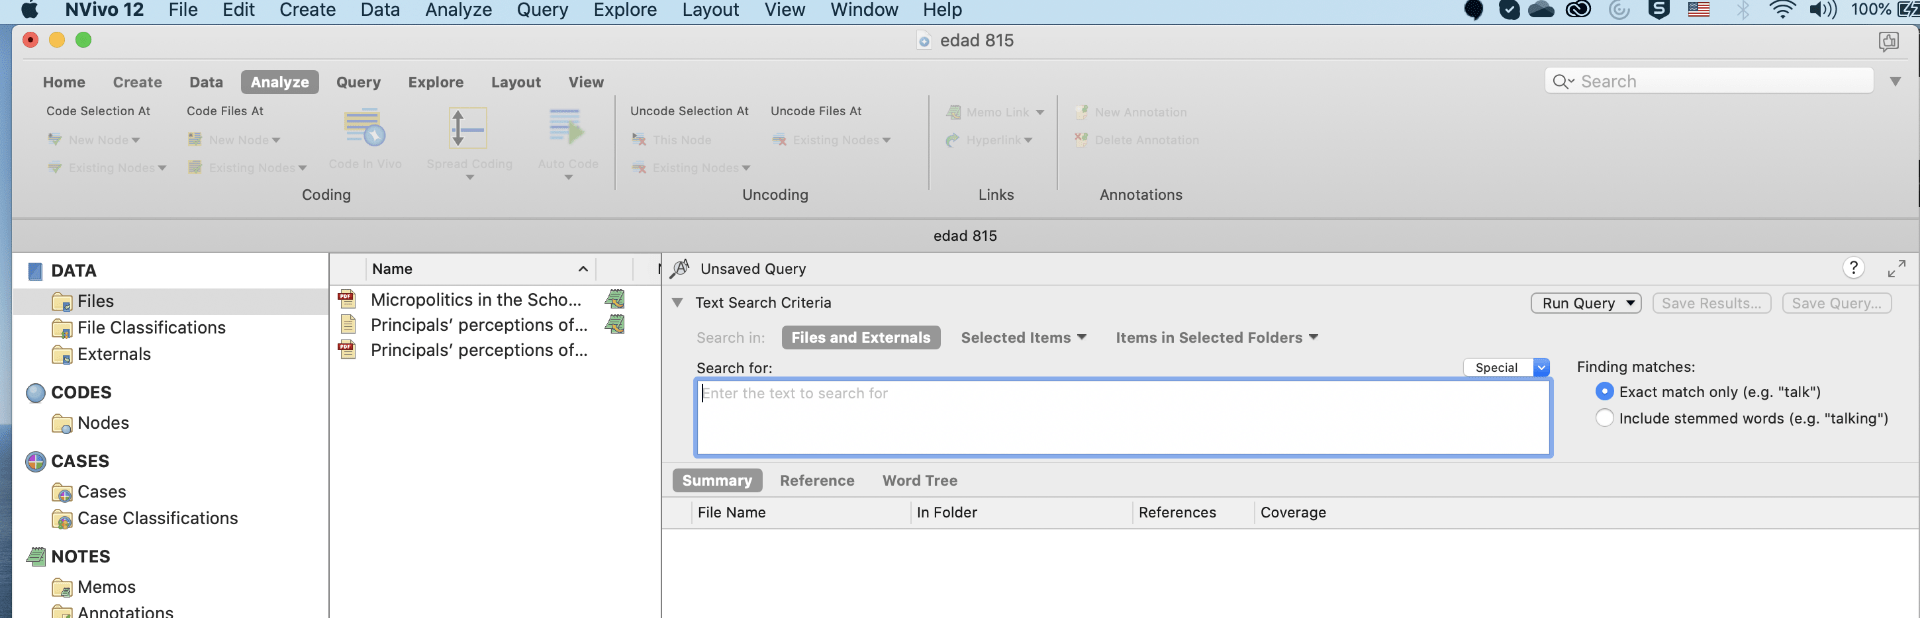
Text search
Text search is more elaborative tool then word frequency search in Nvivo. It allows Nvivo to search for a particular phrase or expression in the articles. Also, Nvivo gives the opportunity to make a node out of text search if a particular word, phrase or expression is found useful for literature.
For example: conduct a text search query to find a word “Scaffolding” in the articles. In this case Nvivo will provide all the words, phrases and expression slightly related to this word across all the articles (Figure 8 & 9). The difference between test search and word frequency lies in generating texts, sentences and phrases in the latter related to the queried word.
Coding query
Apart from text search and word frequency search Nvivo also provides the option of coding query. Coding query helps in literature review to know the intersection between two Nodes. As mentioned previously, nodes contains the information from the articles. Furthermore it is also possible that two nodes contain similar set of information. Therefore, coding query helps to condense this information in the form of two way table which represents the intersection between selected nodes.
For example, in below figure, researcher have search the intersection between three nodes namely, academics, psychological and social on the basis of three attributes namely qantitative, qualitative and mixed research. This coding theory is performed to know which of the selected themes nodes have all types of attributes. Like, Coding Matrix in figure below shows that academic have all three types of attributes that is research (quantitative, qualitative and mixed). Where psychological has only two types of attributes research (quantitative and mixed).
In this way, Coding query helps researchers to generate intersection between two or more theme nodes. This also simplifies the pattern of qualitative data to write literature.
+++++++++++++++++++
Please do not hesitate to contact me with questions, suggestions before, during or after our workshop and about ANY questions and suggestions you may have about your Chapter 2 and, particularly about your literature review:
Many platforms have both qualitative and quantitative capabilities, such as UserZoom and UserTesting
Tips for Remote Facilitating and Presenting:
turn on your camera
Enable connection
Create ground rules
Assign homework
Adapt the structure
Tools for Remote Facilitating and Presenting
Presenting UX work: Zoom, GoToMeeting, and Google Hangouts Meet
Generative workshop activities: Google Draw, Microsoft Visio, Sketch, MURAL, and Miro
Evaluative workshop activities: MURAL or Miro. Alternatively, use survey tools such as SurveyMonkey or CrowdSignal, or live polling apps such as Poll Everywhere that you can insert directly into your slides.
Remote Collaboration and Brainstorming
Consider both synchronous and asynchronous methods
Rienties and his team linked 151 modules (courses) and 111,256 students with students’ behaviour, satisfaction and performance at the Open University UK, using multiple regression models.
There is little correlation between student course evaluations and student performance
The design of the course matters
Student feedback on the quality of a course is really important but it is more useful as a conversation between students and instructors/designers than as a quantitative ranking of the quality of a course. In fact using learner satisfaction as a way to rank teaching is highly misleading. Learner satisfaction encompasses a very wide range of factors as well as the teaching of a particular course.
this research provides quantitative evidence of the importance of learning design in online and distance teaching. Good design leads to better learning outcomes. We need a shift in the power balance between university and college subject experts and learning designers resulting in the latter being treated as at least equals in the teaching process.
Overreliance on data to drive design decisions can be just as harmful as ignoring it. Data only tells one kind of story. But your project goals are often more complex than that. Goals can’t always be objectively measured.
Data-driven design is about using information gleaned from both quantitative and qualitative sources to inform how you make decisions for a set of users. Some common tools used to collect data include user surveys, A/B testing, site usage and analytics, consumer research, support logs, and discovery calls.
Designers justified their value through their innate talent for creative ideas and artistic execution. Those whose instincts reliably produced success became rock stars.
In today’s data-driven world, that instinct is less necessary and holds less power. But make no mistake, there’s still a place for it.
Data is good at measuring things that are easy to measure. Some goals are less tangible, but that doesn’t make them less important.
Data has become an authoritarian who has fired the other advisors who may have tempered his ill will. A designer’s instinct would ask, “Do people actually enjoy using this?” or “How do these tactics reflect on our reputation and brand?”
Deciding between two or three options? This is where data shines. Nothing is more decisive than an A/B test to compare potential solutions and see which one actually performs better. Make sure you’re measuring long-term value metrics and not just views and clicks.
Sweating product quality and aesthetics? Turn to your instinct. The overall feeling of quality is a collection of hundreds of micro-decisions, maintained consistency, and execution with accuracy. Each one of those decisions isn’t worth validating on its own. Your users aren’t design experts, so their feedback will be too subjective and variable. Trust your design senses when finessing the details.
Unsure about user behavior? Use data rather than asking for opinions. When asked what they’ll do, customers will do what they think you want them to. Instead, trust what they actually do when they think nobody’s looking.
Building brand and reputation? Data can’t easily measure this. But we all know trustworthiness is as important as clicks (and sometimes they’re opposing goals). When building long-term reputation, trust your instinct to guide you to what’s appealing, even if it sometimes contradicts short-term data trends. You have to play the long game here.
digital humanities is born f the encounter between traditional humanities and computational methods.
p. 5. From Humanism to Humanities
While the foundations of of humanistic inquiry and the liberal arts can be traced back in the west to the medieval trivium and quadrivium, the modern and human sciences are rooted in the Renaissance shift from a medieval, church dominated, theocratic world view to be human centered one period the gradual transformation of early humanism into the disciplines that make up the humanities today Was profoundly shaped by the editorial practices involved in the recovery of the corpus of works from classical antiquity
P. 6. The shift from humanism to the institution only sanctioned disciplinary practices and protocols that we associate with the humanities today is best described as a gradual process of subdivision and specialization.
P. 7. Text-based disciplines in studies (classics, literature, philosophy, the history of ideas) make up, from the very start, the core of both the humanities and the great books curricular instituted in the 1920s and 1930s.
P. 10. Transmedia modes of argumentation
In the 21st-century, we communicate in media significantly more varied, extensible, and multiplicative then linear text. From scalable databases to information visualizations, from video lectures to multi-user virtual platforms serious content and rigorous argumentation take shape across multiple platforms in media. The best digital humanities pedagogy and research projects train students both in “reading “and “writing “this emergent rhetoric and in understanding how the reshape and three model humanistic knowledge. This means developing critically informed literacy expensive enough to include graphic design visual narrative time based media, and the development of interfaces (Rather then the rote acceptance of them as off-the-shelf products).
P. 11. The visual becomes ever more fundamental to the digital humanities, in ways that compliment, enhance, and sometimes are in pension with the textual.
There is no either/or, no simple interchangeability between language and the visual, no strict sub ordination of the one to the other. Words are themselves visual but other kinds of visual constructs do different things. The question is how to use each to its best effect into device meaningful interpret wing links, to use Theodor Nelson’s ludic neologism.
P. 11. The suite of expressive forms now encompasses the use of sound, motion graphics, animation, screen capture, video, audio, and the appropriation and into remix sink of code it underlines game engines. This expanded range of communicative tools requires those who are engaged in digital humanities world to familiarize themselves with issues, discussions, and debates in design fields, especially communication and interaction design. Like their print predecessors, form at the convention center screen environments can become naturalized all too quickly, with the results that the thinking that informed they were designed goes unperceived.
p. 13.
For digital humanists, design is a creative practice harnessing cultural, social, economic, and technological constraints in order to bring systems and objects into the world. Design in dialogue with research is simply a picnic, but when used to pose in frame questions about knowledge, design becomes an intellectual method. Digital humanities is a production based in Denver in which theoretical issues get tested in the design of implementations and implementations or loci after your radical reflection and elaboration.
Did you thaw humanists have much to learn from communication and media design about how to juxtapose and integrate words and images create hire he is of reading, Forge pathways of understanding, deployed grades in templates to best effect, and develop navigational schemata that guide in produce meaningful interactions.
P. 15. The field of digital digital humanities me see the emergence of polymaths who can “ do it all” : Who can research, write, shoot, edit, code, model, design, network, and dialogue with users. But there is also ample room for specialization and, particularly, for collaboration.
P. 16. Computational activities in digital humanities.
The foundational layer, computation, relies on principles that are, on the surface, at odds with humanistic methods.
P. 17. The second level involves processing in a way that conform to computational capacities, and this were explored in the first generation of digital scholarship and stylometrics, concordance development, and indexing.
P. 17.
Duration, analysis, editing, modeling.
Duration, analysis, editing, and modeling comprise fundamental activities at the core of digital humanities. Involving archives, collections, repositories, and other aggregations of materials, duration is the selection and organization of materials in an interpretive framework, argument, or exhibit.
P. 18. Analysis refers to the processing of text or data: statistical and quantitative methods of analysis have brought close readings of texts (stylometrics and genre analysis, correlation, comparisons of versions for alter attribution or usage patterns ) into dialogue with distant reading (The crunching cuff large quantities of information across the corpus of textual data or its metadata).
Edit think has been revived with the advent of digital media and the web and to continue to be an integral activity in textual as well as time based formats.
P. 18. Model link highlights the notion of content models- shapes of argument expressed in information structures in their design he digital project is always an expression of assumptions about knowledge: usually domain specific knowledge given an explicit form by the model in which it is designed.
P. 19. Each of these areas of activity- cure ration, analysis, editing, and modeling is supported by the basic building blocks of digital activity. But they also depend upon networks and infrastructure that are cultural and institutional as well as technical. Servers, software, and systems administration are key elements of any project design.
P. 30. Digital media are not more “evolved” have them print media nor are books obsolete; but the multiplicity of media in the very processes of mediation entry mediation in the formation of cultural knowledge and humanistic inquiry required close attention. Tug link between distant and clothes, macro and micro, and surface in depth becomes the norm. Here, we focus on the importance of visualization to the digital humanities before moving on to other, though often related, genre and methods such as Locative investigation, thick mapping, animated archives, database documentaries, platform studies, and emerging practices like cultural analytics, data mining and humanities gaming.
P. 35. Fluid texture out what he refers to the mutability of texts in the variants and versions Whether these are produced through Authorial changes, anything, transcription, translation, or print production
Cultural Analytics, aggregation, and data mining.
The field of cultural Analytics has emerged over the past few years, utilizing tools of high-end computational analysis and data visualization today sect large-scale coach data sets. Cultural Analytic does Not analyze cultural artifacts, but operates on the level of digital models of this materials in aggregate. Again, the point is not to pit “close” hermeneutic reading against “distant” data mapping, but rather to appreciate the synergistic possibilities and tensions that exist between a hyper localized, deep analysis and a microcosmic view
p. 42.
Data mining is a term that covers a host of picnics for analyzing digital material by “parameterizing” some feature of information and extract in it. This means that any element of a file or collection of files that can be given explicit specifications, or parameters, can be extracted from those files for analysis.
Understanding the rehtoric of graphics is another essential skill, therefore, in working at a skill where individual objects are lost in the mass of processed information and data. To date, much humanities data mining has merely involved counting. Much more sophisticated statistical methods and use of probability will be needed for humanists to absorb the lessons of the social sciences into their methods
P. 42. Visualization and data design
Currently, visualization in the humanities uses techniques drawn largely from the social sciences, Business applications, and the natural sciences, all of which require self-conscious criticality in their adoption. Such visual displays including graphs and charts, may present themselves is subjective or even unmediated views of reality, rather then is rhetorical constructs.
+++++++++++++++++++++++++++
Warwick, C., Terras, M., & Nyhan, J. (2012). Digital humanities in practice . London: Facet Publishing in association with UCL Centre for Digital Humanities.
Summary This short paper lays out an attempt to measure how much activity from Russian state-operated accounts released in the dataset made available by Twitter in October 2018 was targeted at the United Kingdom. Finding UK-related Tweets is not an easy task. By applying a combination of geographic inference, keyword analysis and classification by algorithm, we identified UK-related Tweets sent by these accounts and subjected them to further qualitative and quantitative analytic techniques.
We find:
There were three phases in Russian influence operations : under-the-radar account building, minor Brexit vote visibility, and larger-scale visibility during the London terror attacks.
Russian influence operations linked to the UK were most visible when discussing Islam . Tweets discussing Islam over the period of terror attacks between March and June 2017 were retweeted 25 times more often than their other messages.
The most widely-followed and visible troll account, @TEN_GOP, shared 109 Tweets related to the UK. Of these, 60 percent were related to Islam .
The topology of tweet activity underlines the vulnerability of social media users to disinformation in the wake of a tragedy or outrage.
Focus on the UK was a minor part of wider influence operations in this data . Of the nine million Tweets released by Twitter, 3.1 million were in English (34 percent). Of these 3.1 million, we estimate 83 thousand were in some way linked to the UK (2.7%). Those Tweets were shared 222 thousand times. It is plausible we are therefore seeing how the UK was caught up in Russian operations against the US .
Influence operations captured in this data show attempts to falsely amplify other news sources and to take part in conversations around Islam , and rarely show attempts to spread ‘fake news’ or influence at an electoral level.
On 17 October 2018, Twitter released data about 9 million tweets from 3,841 blocked accounts affiliated with the Internet Research Agency (IRA) – a Russian organisation founded in 2013 and based in St Petersburg, accused of using social media platforms to push pro-Kremlin propaganda and influence nation states beyond their borders, as well as being tasked with spreading pro-Kremlin messaging in Russia. It is one of the first major datasets linked to state-operated accounts engaging in influence operations released by a social media platform.
Conclusion
This report outlines the ways in which accounts linked to the Russian Internet ResearchAgency (IRA) carried out influence operations on social media and the ways their operationsintersected with the UK.The UK plays a reasonably small part in the wider context of this data. We see two possibleexplanations: either influence operations were primarily targeted at the US and British Twitterusers were impacted as collate, or this dataset is limited to US-focused operations whereevents in the UK were highlighted in an attempt to impact US public, rather than a concertedeffort against the UK. It is plausible that such efforts al so existed but are not reflected inthis dataset.Nevertheless, the data offers a highly useful window into how Russian influence operationsare carried out, as well as highlighting the moments when we might be most vulnerable tothem.Between 2011 and 2016, these state-operated accounts were camouflaged. Through manualand automated methods, they were able to quietly build up the trappings of an active andwell-followed Twitter account before eventually pivoting into attempts to influence the widerTwitter ecosystem. Their methods included engaging in unrelated and innocuous topics ofconversation, often through automated methods, and through sharing and engaging withother, more mainstream sources of news.Although this data shows levels of electoral and party-political influence operations to berelatively low, the day of the Brexit referendum results showed how messaging originatingfrom Russian state-controlled accounts might come to be visible – on June 24th 2016, we believe UK Twitter users discussing the Brexit Vote would have encountered messages originating from these accounts.As early as 2014, however, influence operations began taking part in conversations aroundIslam, and these accounts came to the fore during the three months of terror attacks thattook place between March and June 2017. In the immediate wake of these attacks, messagesrelated to Islam and circulated by Russian state-operated Twitter accounts were widelyshared, and would likely have been visible in the UK.The dataset released by Twitter begins to answer some questions about attempts by a foreignstate to interfere in British affairs online. It is notable that overt political or electoralinterference is poorly represented in this dataset: rather, we see attempts at stirring societaldivision, particularly around Islam in the UK, as the messages that resonated the most overthe period.What is perhaps most interesting about this moment is its portrayal of when we as socialmedia users are most vulnerable to the kinds of messages circulated by those looking toinfluence us. In the immediate aftermath of terror attacks, the data suggests, social mediausers were more receptive to this kind of messaging than at any other time.
It is clear that hostile states have identified the growth of online news and social media as aweak spot, and that significant effort has gone into attempting to exploit new media toinfluence its users. Understanding the ways in which these platforms have been used tospread division is an important first step to fighting it.Nevertheless, it is clear that this dataset provides just one window into the ways in whichforeign states have attempted to use online platforms as part of wider information warfare
and influence campaigns. We hope that other platforms will follow Twitter’s lead and release
similar datasets and encourage their users to proactively tackle those who would abuse theirplatforms.