Society for Information Technology and Teacher Education site.aace.org
March 5 – 9, 2017 Austin, Texas, USA
Proposals Due: October 21, 2016
SITE 2017 is the 28th annual conference of the Society for Information Technology and Teacher Education. This society represents individual teacher educators and affiliated organizations of teacher educators in all disciplines, who are interested in the creation and dissemination of knowledge about the use of information technology in teacher education and faculty/staff development.
SITE is unique as the only organization which has as its sole focus the integration of instructional technologies into teacher education programs. SITE promotes the development and dissemination of theoretical knowledge, conceptual research, and professional practice knowledge through conferences, books, projects, and the Journal of Technology and Teacher Education (JTATE).
You are invited to attend and participate in this annual international forum which offer numerous opportunities to share your ideas, explore the research, development, and applications, and to network with the leaders in this important field of teacher education and technology.
The Conference Review Policy requires that each proposal will be peer- reviewed by three reviewers for inclusion in the conference program, and conference proceedings.
Enquiries: conf@aace.org
Hosted By: AACE.org – The Association for the Advancement of Computing in Education
Sponsored by: LearnTechLib.org – The Learning and Technology Library
Faculty perceive undergraduates to be less proficient with digital literacy skills. One-third think
their students do not find or organize digital information very well. The majority (52%) think
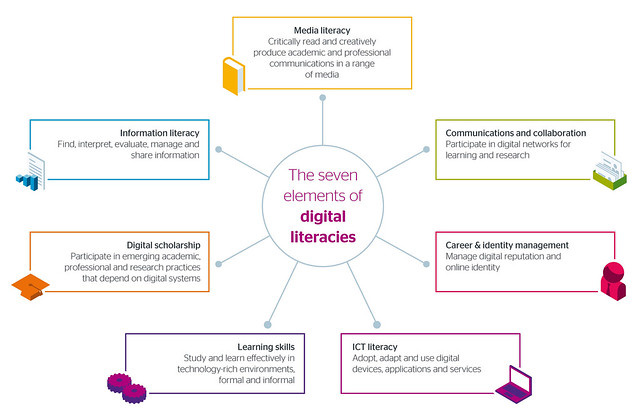
they lack skill in validating digital information. My note: for the SCSU librarians, digital literacy is fancy word for information literacy. Digital literacy, as used in this report is much greater area, which encompasses much broader set of skills
Faculty do not prefer to teach online (57%) or in a hybrid format (where some sessions occur
online, 32%). One-third of faculty reported no experience with these least popular course types
my note: pay attention to the questions asked; questions I am asking Mike Penrod to let me work with faculty for years. Questions, which are snubbed by CETL and a dominance of D2L and MnSCU mandated tools is established.
Table 5. Do you use these in-class technologies for teaching undergraduates? Which are the Top 3 in-class technologies you would like to learn or use more? (n = 442)
usingonline resourcesto find high quality curricular materials
37%
48%
31%
3%
18%
iClickers
24%
23%
16%
9%
52%
otherpresentation tool (Prezi, Google presentation, Slide Carnival, etc.)
23%
14%
21%
15%
51%
whiteboard / blackboard
20%
58%
23%
6%
14%
Powerpoint or Keynote
20%
74%
16%
4%
5%
document camera / overhead projector
15%
28%
20%
14%
38%
Table 6. Do you have undergraduates use these assignment technology tools? Which are your Top 3 assignment technology tools to learn about or use more? (n = 432)
D2Lasa portal to other learning tools (homework websites, videos, simulations, Nota Bene/NB, Voice Thread, etc.)
21%
28%
18%
11%
42%
videos/animationsproducedelsewhere
19%
40%
36%
2%
22%
In both large and small classes, the most common responses faculty make to digital distraction are to discuss why it is a problem and to limit or ban phones in class. my note: which completely defies the BYOD and turns into empty talk / lip service.
Quite a number of other faculty (n = 18) reported putting the onus on themselves to plan engaging and busy class sessions to preclude distraction, for example:
“If my students are more interested in their laptops than my course material, I need to make my curriculum more interesting.”
I have not found this to be a problem. When the teaching and learning are both engaged/engaging, device problems tend to disappear.”
The most common complaint related to students and technology was their lack of common technological skills, including D2L and Google, and needing to take time to teach these skills in class (n = 14). Two commented that digital skills in today’s students were lower than in their students 10 years ago.
Table 9. Which of the following are the most effective types of learning opportunities about teaching, for you? Chose your Top 2-3. (n = 473)
Count Percentage
meeting 1:1 with anexpert
296
63%
hour-longworkshop
240
51%
contact an expert on-call (phone, email, etc)
155
33%
faculty learning community (meeting across asemester,
e.g. ASSETT’s Hybrid/Online Course Design Seminar)
116
25%
expert hands-on support for course redesign (e.g. OIT’s Academic Design Team)
114
24%
opportunityto apply for grant funding with expert support, for a project I design (e.g. ASSETT’s Development Awards)
97
21%
half-dayorday-longworkshop
98
21%
other
40
8%
multi-day retreats/ institutes
30
6%
Faculty indicated that the best times for them to attend teaching professional developments across the year are before and early semester, and summer. They were split among all options for meeting across one week, but preferred afternoon sessions to mornings. Only 8% of respondents (n = 40) indicated they would not likely attend any professional development session (Table 10).
Table T1: Faculty beliefs about using digital technologies in teaching
Count
Column N%
Technology is a significant barrier to teaching and learning.
1
0.2%
Technology can have a place in teaching, but often detracts from teaching and learning.
76
18.3%
Technology has a place in teaching, and usually enhances the teaching learning process.
233
56.0%
Technology greatly enhances the teaching learning process.
106
25.5%
Table T2: Faculty beliefs about the impact of technology on courses
Count
Column N%
Makes a more effective course
302
72.6%
Makes no difference in the effectiveness of a course
42
10.1%
Makes a less effective course
7
1.7%
Has an unknown impact
65
15.6%
Table T3: Faculty use of common technologies (most frequently selected categories shaded)
Once a month or less
A few hours a month
A few hours a week
An hour a day
Several hours a day
Count
%
Count
%
Count
%
Count
%
Count
%
Computer
19
4.8%
15
3.8%
46
11.5%
37
9.3%
282
70.7%
Smart Phone
220
60.6%
42
11.6%
32
8.8%
45
12.4%
24
6.6%
Office Software
31
7.8%
19
4.8%
41
10.3%
82
20.6%
226
56.6%
Email
1
0.2%
19
4.6%
53
12.8%
98
23.7%
243
58.7%
Social Networking
243
68.8%
40
11.3%
40
11.3%
23
6.5%
7
2.0%
Video/Sound Media
105
27.6%
96
25.2%
95
24.9%
53
13.9%
32
8.4%
Table T9: One sample t-test for influence of technology on approaches to grading and assessment
Test Value = 50
t
df
Sig. (2-tailed)
Mean Difference
95% Confidence Interval of the Difference
Lower
Upper
In class tests and quizzes
-4.369
78
.000
-9.74684
-14.1886
-5.3051
Online tests and quizzes
5.624
69
.000
14.77143
9.5313
20.0115
Ungraded assessments
1.176
66
.244
2.17910
-1.5208
5.8790
Formative assessment
5.534
70
.000
9.56338
6.1169
13.0099
Short essays, papers, lab reports, etc.
2.876
70
.005
5.45070
1.6702
9.2312
Extended essays and major projects or performances
1.931
69
.058
3.67143
-.1219
7.4648
Collaborative learning projects
.000
73
1.000
.00000
-4.9819
4.9819
Table T10: Rate the degree to which your role as a faculty member and teacher has changed as a result of increased as a result of increased use of technology
Strongly Disagree
Disagree
Somewhat Disagree
Somewhat Agree
Agree
Strongly Agree
Count
%
Count
%
Count
%
Count
%
Count
%
Count
%
shifting from the role of content expert to one of learning facilitator
12
9.2%
22
16.9%
14
10.8%
37
28.5%
29
22.3%
16
12.3%
your primary role is to provide content for students
14
10.9%
13
10.1%
28
21.7%
29
22.5%
25
19.4%
20
15.5%
your identification with your University is increased
23
18.3%
26
20.6%
42
33.3%
20
15.9%
12
9.5%
3
2.4%
you have less ownership of your course content
26
20.2%
39
30.2%
24
18.6%
21
16.3%
14
10.9%
5
3.9%
your role as a teacher is strengthened
13
10.1%
12
9.3%
26
20.2%
37
28.7%
29
22.5%
12
9.3%
your overall control over your course(s) is diminished
23
17.7%
44
33.8%
30
23.1%
20
15.4%
7
5.4%
6
4.6%
Table T14: One sample t-test for influence of technology on faculty time spent on specific teaching activities
Test Value = 50
t
df
Sig. (2-tailed)
Mean Difference
95% Confidence Interval of the Difference
Lower
Upper
Lecturing
-7.381
88
.000
-12.04494
-15.2879
-8.8020
Preparing course materials
9.246
96
.000
16.85567
13.2370
20.4744
Identifying course materials
8.111
85
.000
13.80233
10.4191
17.1856
Grading / assessing
5.221
87
.000
10.48864
6.4959
14.4813
Course design
12.962
94
.000
21.55789
18.2558
24.8600
Increasing access to materials for all types of learners
Journal of Technology and Teacher EducationVolume 24, Number 2, ISSN 1059-7069 Publisher: Society for Information Technology & Teacher Education, Chesapeake, VA
The majority of the participants were female. All of the participants were junior and senior students enrolled in elementary teacher education programs. Specifically, this study compared pre-service teachers’ self-efficacy, outcome expectations, intentions (internal factors) and perceived school climate (external factor) for technology integration in education in these countries.
Unlike Turkey and the US, self-efficacy predicted technology integration intention to a smaller degree than school climate in the Spanish sample. Interestingly, outcome expectations scores did not make a statistically significant contribution to predicting pre-service teachers’ intention to use technology in the US sample.
This year we’d like to involve a wider segment of the teaching and learning community to help us design the survey. Please join us online for one of two 30-minute discussion sessions:
Sept 14 at 12pm ET OR Sept 15 at 2pm ET
To join, just go to https://educause.acms.com/eliweb on the date and time of the session and join as a guest. No registration or login needed.
A New Great Communication Tool for Teachers and Parents
https://plus.google.com/+Educatorstechnology/posts/1J72fQCDqM7
July 7, 2016 Appletree is a new educational platform that was recently introduced at ISTE 2016. Apple tree is a classroom communication tool that makes it super easy for teachers to communicate with parents and enhance students learning.
doctoral cohort student’s request for literature: “I am looking for some more resources around the historical context of teacher evaluation.”
pre-existing bibliography:
Allen, J., Gregory, A., Mikami, A. I., Lun, J., Hamre, B., & Pianta, R. (2013). Observations of Effective Teacher-Student Interactions in Secondary School Classrooms: Predicting Student Achievement With the Classroom Assessment Scoring System—Secondary. School Psychology Review, 42(1), 76–98.
Baker, B. D., Oluwole, J. O., & Green, P. C. (2013). The Legal Consequences of Mandating High Stakes Decisions Based on Low Quality Information: Teacher Evaluation in the Race-to-the-Top Era. Education Policy Analysis Archives, 21(5), 1–71. http://doi.org/http://epaa.asu.edu/ojs/article/view/1298
Benedict, A. E., Thomas, R. a., Kimerling, J., & Leko, C. (2013). Trends in Teacher Evaluation. Teaching Exceptional Children. May/Jun2013, 45(5), 60–68.
Bonavitacola, A. C., Guerrazzi, E., & Hanfelt, P. (2014). TEACHERS’ PERCEPTIONS OF THE IMPACT OF THE McREL TEACHER EVALUATION SYSTEM ON PROFESSIONAL GROWTH.
Charlotte Danielson. (2016). Creating Communities of Practice. Educational Leadership, (May), 18 – 23.
Darling-Hammond, L., Wise, A. E., & Pease, S. R. (1983). Teacher Evaluation in the Organizational Context: A Review of the Literature. Review of Educational Research, 53(3), 285–328. http://doi.org/10.3102/00346543053003285
Darling-Hammond, L., Jaquith, A., & Hamilton, M. (n.d.). Creating a Comprehensive System for Evaluating and Supporting Effective Teaching.
Derrington, M. L. (n.d.). Changes in Teacher Evaluation: Implications for the Principal’s Work.
Gallagher, H. A. (2004). Vaughn Elementary’s Innovative Teacher Evaluation System: Are Teacher Evaluation Scores Related to Growth in Student Achievement? Peabody Journal of Education, 79(4), 79–107. http://doi.org/10.1207/s15327930pje7904_5
Hallgren, K., James-Burdumy, S., & Perez-Johnson, I. (2014). STATE REQUIREMENTS FOR TEACHER EVALUATION POLICIES PROMOTED BY RACE TO THE TOP.
Hattie Helen E-Mail Address, J. T., Hattie, J., & Timperley, H. (2007). The power of feedback. [References]. Review of Educational Research, .77(1), 16–7. http://doi.org/10.3102/003465430298487
Ingle, W. K., Willis, C., & Fritz, J. (2014). Collective Bargaining Agreement Provisions in the Wake of Ohio Teacher Evaluation System Legislation. Educational Policy. http://doi.org/10.1177/0895904814559249
Moskal, A. C. M., Stein, S. J., & Golding, C. (2016). Assessment & Evaluation in Higher Education Can you increase teacher engagement with evaluation simply by improving the evaluation system? Can you increase teacher engagement with evaluation simply by improving the evaluation system? http://doi.org/10.1080/02602938.2015.1007838
Quinn, A. E. (n.d.). The Delta Kappa Gamma Bulletin Looking a t th e B igger Picture w ith Dr. R o b ert M arzan o : Teacher E valuation and D e v e lo p m e n t fo r Im p ro ved S tu d en t Learning.
Riordan, J., Lacireno-Paquet, Shakman, N., Bocala, K., & Chang, C. (2015). Redesigning teacher evaluation: Lessons from a pilot implementation. Retrieved from http://ies.ed.gov/
Taylor, E. S., & Tyler, J. H. (n.d.). Evidence of systematic growth in the effectiveness of midcareer teachers Can Teacher Evaluation Improve Teaching?
Tuytens, M., & Devos, G. (n.d.). The problematic implementation of teacher evaluation policy: School failure or governmental pitfall? http://doi.org/10.1177/1741143213502188
Wong, W. Y., & Moni, K. (2013). Teachers’ perceptions of and responses to student evaluation of teaching: purposes and uses in clinical education. http://doi.org/10.1080/02602938.2013.844222
my list of literature:
Avalos, B., & Assael, J. (2006). Moving from resistance to agreement: The case of the Chilean teacher performance evaluation. International Journal of Educational Research, 45(4-5), 254-266.
Cowen, J. M., & Fowles, J. (2013). Same contract, different day? an analysis of teacher bargaining agreements in Louisville since 1979. Teachers College Record, 115(5)
Flippo, R. F. (2002). Repeating history: Teacher licensure testing in Massachusetts. Journal of Personnel Evaluation in Education, 16(3), 211-29.
Griffin, G. (1997). Teaching as a gendered experience. Journal of Teacher Education, 48(1), 7-18.
Hellawell, D. E. (1992). Structural changes in education in England. International Journal of Educational Reform, 1(4), 356-65.
Hibler, D. W., & Snyder, J. A. (2015). Teaching matters: Observations on teacher evaluations. Schools: Studies in Education, 12(1), 33-47.
Hill, H. C., & Grossman, P. (2013). Learning from teacher observations: Challenges and opportunities posed by new teacher evaluation systems. Harvard Educational Review, 83(2), 371-384.
Hines, L. M. (2007). Return of the thought police?: The history of teacher attitude adjustment. Education Next, 7(2), 58-65.
Kersten, T. A. (2006). Teacher tenure: Illinois school board presidents’ perspectives and suggestions for improvement. Planning and Changing, 37(3-4), 234-257.
Kersten, T. A., & Israel, M. S. (2005). Teacher evaluation: Principals’ insights and suggestions for improvement. Planning and Changing, 36(1-2), 47-67.
Korkmaz, I. (2008). Evaluation of teachers for restructured elementary curriculum (grades 1 to 5). Education, 129(2), 250-258.
Lamb, M. L., & Swick, K. J. (1975). Historical overview of teacher observation Educational Forum.
Maharaj, S. (2014). Administrators’ views on teacher evaluation: Examining Ontario’s teacher performance appraisal. Canadian Journal of Educational Administration and Policy, (152)
Naba’h, A. A., Al-Omari, H., Ihmeideh, F., & Al-Wa’ily, S. (2009). Teacher education programs in Jordan: A reform plan. Journal of Early Childhood Teacher Education, 30(3), 272-284.
Ornstein, A. C. (1977). Critics and criticism of education Educational Forum.
Pajak, E., & Arrington, A. (2004). Empowering a profession: Rethinking the roles of administrative evaluation and instructional supervision in improving teacher quality. Yearbook of the National Society for the Study of Education, 103(1), 228-252.
Stamelos, G., & Bartzakli, M. (2013). The effect of a primary school teachers, trade union on the formation and realisation of policy in Greece: The case of teacher evaluation policy. Policy Futures in Education, 11(5), 575-588.
Stamelos, G., Vassilopoulos, A., & Bartzakli, M. (2012). Understanding the difficulties of implementation of a teachers’ evaluation system in greek primary education: From national past to european influences. European Educational Research Journal, 11(4), 545-557.
Sullivan, J. P. (2012). A collaborative effort: Peer review and the history of teacher evaluations in Montgomery county, Maryland. Harvard Educational Review, 82(1), 142-152.
Tierney, W. G., & Lechuga, V. M. (2005). Academic freedom in the 21st century. Thought & Action, , 7-22.
Turri, M. (2014). The new italian agency for the evaluation of the university system (ANVUR): A need for governance or legitimacy? Quality in Higher Education, 20(1), 64-82.
VanPatten, J. J. (1972). Some reflections on accountability Journal of Thought.
Vijaysimha, I. (2013). Teachers as professionals: Accountable and autonomous? review of the report of the justice Verma commission on teacher education. august 2012. department of school education and literacy, ministry of human resource development, government of India. Contemporary Education Dialogue, 10(2), 293-299.
Vold, D. J. (1985). The roots of teacher testing in America. Educational Measurement: Issues and Practice, 4(3), 5-7.
Wermke, W., & Höstfält, G. (2014). Contextualizing teacher autonomy in time and space: A model for comparing various forms of governing the teaching profession. Journal of Curriculum Studies, 46(1), 58-80.
Ydesen, C., & Andreasen, K. E. (2014). Accountability practices in the history of Danish primary public education from the 1660s to the present. Education Policy Analysis Archives, 22(120)
three shifts in policy and leadership culture may help move these efforts forward:
New types of assessment are gaining ground. Several states are piloting performance-based assessments to replace standardized testing.
Exemplars in the business community are now promoting flat organizational structures, where employees work in smaller teams and have more voice and power over how they work.
Teachers are more networked than ever before, providing a unique opportunity to share and spread good teaching practice.
While the hybrid roles that teachers play at teacher-powered schoolsmay seem like a lot of work, they give teachers the power to decide what programs, textbooks, software, etc., should or should not be used in order to make space for the community’s vision. And when teachers decide together on the vision and strategy to reach all students, they are often more invested and excited by the change they are creating from within.
Some of the best available examples of how to improve teacher quality and promote teacher leadership lie in models offered by other high-performing places, like Finland and Singapore.
Seven qualities must be in place.
A vision and strategy for teacher leadership, “with stated goals and clear images of tasks to be done, must be in place.” Teachers must feel part of creating this vision in order to buy in.
A supportive administration. “Principals must be willing to share power with teachers and must have the skills to cultivate them as leaders,” most educational leadership programs focus on supervising teachers, not supporting them as leaders.
There need to be appropriate human and fiscal resources.
Work structures that enable authentic collaboration are crucial. While more resources help on this point, there are creative ways to stretch limited dollars.
Supportive social norms and working relationships are key to teacher leadership. “All too often, policymakers develop incentives to motivate teachers and administrators,” . “Instead, policies and programs should be in place to value teachers spreading their expertise to one another, allowing teaching to be exercised as a team sport.”
Organizational politics must allow for blurred lines between roles. Teachers can only take on leadership roles at the expense of principals and district-level administrators. This also requires teacher unions to act more as “professional guilds” and for districts to follow the example of some for-profit businesses that are flattening bureaucracies.
The school and system must be oriented toward risk-taking and inquiry. Just as students need hands-on applied learning rooted in inquiry, so, too, do teachers need powerful driving questions to push their work forward. “School systems must be able to interrogatethemselves about the extent to which they create opportunities for teachers to learn and lead in ways that spread teaching expertise and improve student outcomes.”
After surveying more than 4,650 educators, we learned that teachers are essentially trying to do three things with data—each of which technology can dramatically improve:
The U.S. Department of Education has increasingly encouraged and funded states to collect and analyze information about students: grades, state test scores, attendance, behavior, lateness, graduation rates and school climate measures like surveys of student engagement.
The argument in favor of all this is that the more we know about how students are doing, the better we can target instruction and other interventions. And sharing that information with parents and the community at large is crucial. It can motivate big changes.
what might be lost when schools focus too much on data. Here are five arguments against the excesses of data-driven instruction.
The National Education Policy Center releases annual reports on commercialization and marketing in public schools. In its most recent report in May, researchers there raised concerns about targeted marketing to students using computers for schoolwork and homework. Companies like Google pledge not to track the content of schoolwork for the purposes of advertising. But in reality these boundaries can be a lot more porous. For example, a high school student profiled in the NEPC report often consulted commercial programs like dictionary.com and Sparknotes: “Once when she had been looking at shoes, she mentioned, an ad for shoes appeared in the middle of a Sparknotes chapter summary.”
4) Missing What Data Can’t Capture
Computer systems are most comfortable recording and analyzing quantifiable, structured data. The number of absences in a semester, say; or a three-digit score on a multiple-choice test that can be graded by machine, where every question has just one right answer.
5) Exposing Students’ “Permanent Records”
In the past few years several states have passed laws banning employers from looking at the credit reports of job applicants. Employers want people who are reliable and responsible. But privacy advocates argue that a past medical issue or even a bankruptcy shouldn’t unfairly dun a person who needs a fresh start.
The eCampus Quality Instruction Program (eQIP) is an online faculty development program developed to train faculty in designing and teaching fully online courses.
What is the best way to design and develop high- quality online courses and support faculty as they teach online?
Given faculty’s competing priorities and limited time, we contend that it is important for institutions, and specifically faculty developers, to analyze how much time faculty are spending in online faculty development activities as well as which parts are taking the most (or least) time. (p. 5)
A successful online faculty development program must include pedagogical support, technology support, and design and development support (Baran & Correia, 2014) that overcome obstacles about time, expertise, and motivation of faculty (Henning, 2012).(p. 17)