Faculty perceive undergraduates to be less proficient with digital literacy skills. One-third think
their students do not find or organize digital information very well. The majority (52%) think
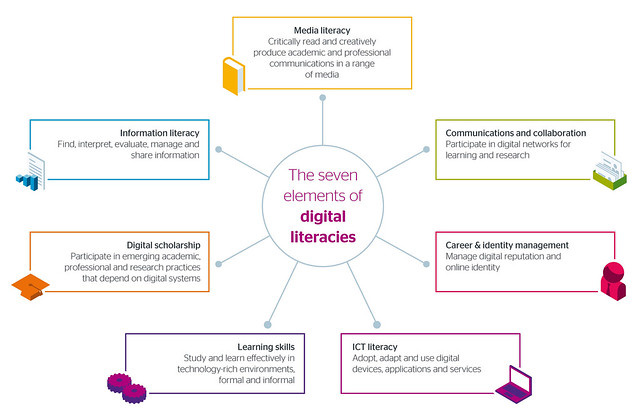
they lack skill in validating digital information. My note: for the SCSU librarians, digital literacy is fancy word for information literacy. Digital literacy, as used in this report is much greater area, which encompasses much broader set of skills
Faculty do not prefer to teach online (57%) or in a hybrid format (where some sessions occur
online, 32%). One-third of faculty reported no experience with these least popular course types
my note: pay attention to the questions asked; questions I am asking Mike Penrod to let me work with faculty for years. Questions, which are snubbed by CETL and a dominance of D2L and MnSCU mandated tools is established.
Table 5. Do you use these in-class technologies for teaching undergraduates? Which are the Top 3 in-class technologies you would like to learn or use more? (n = 442)
usingonline resourcesto find high quality curricular materials
37%
48%
31%
3%
18%
iClickers
24%
23%
16%
9%
52%
otherpresentation tool (Prezi, Google presentation, Slide Carnival, etc.)
23%
14%
21%
15%
51%
whiteboard / blackboard
20%
58%
23%
6%
14%
Powerpoint or Keynote
20%
74%
16%
4%
5%
document camera / overhead projector
15%
28%
20%
14%
38%
Table 6. Do you have undergraduates use these assignment technology tools? Which are your Top 3 assignment technology tools to learn about or use more? (n = 432)
D2Lasa portal to other learning tools (homework websites, videos, simulations, Nota Bene/NB, Voice Thread, etc.)
21%
28%
18%
11%
42%
videos/animationsproducedelsewhere
19%
40%
36%
2%
22%
In both large and small classes, the most common responses faculty make to digital distraction are to discuss why it is a problem and to limit or ban phones in class. my note: which completely defies the BYOD and turns into empty talk / lip service.
Quite a number of other faculty (n = 18) reported putting the onus on themselves to plan engaging and busy class sessions to preclude distraction, for example:
“If my students are more interested in their laptops than my course material, I need to make my curriculum more interesting.”
I have not found this to be a problem. When the teaching and learning are both engaged/engaging, device problems tend to disappear.”
The most common complaint related to students and technology was their lack of common technological skills, including D2L and Google, and needing to take time to teach these skills in class (n = 14). Two commented that digital skills in today’s students were lower than in their students 10 years ago.
Table 9. Which of the following are the most effective types of learning opportunities about teaching, for you? Chose your Top 2-3. (n = 473)
Count Percentage
meeting 1:1 with anexpert
296
63%
hour-longworkshop
240
51%
contact an expert on-call (phone, email, etc)
155
33%
faculty learning community (meeting across asemester,
e.g. ASSETT’s Hybrid/Online Course Design Seminar)
116
25%
expert hands-on support for course redesign (e.g. OIT’s Academic Design Team)
114
24%
opportunityto apply for grant funding with expert support, for a project I design (e.g. ASSETT’s Development Awards)
97
21%
half-dayorday-longworkshop
98
21%
other
40
8%
multi-day retreats/ institutes
30
6%
Faculty indicated that the best times for them to attend teaching professional developments across the year are before and early semester, and summer. They were split among all options for meeting across one week, but preferred afternoon sessions to mornings. Only 8% of respondents (n = 40) indicated they would not likely attend any professional development session (Table 10).
Table T1: Faculty beliefs about using digital technologies in teaching
Count
Column N%
Technology is a significant barrier to teaching and learning.
1
0.2%
Technology can have a place in teaching, but often detracts from teaching and learning.
76
18.3%
Technology has a place in teaching, and usually enhances the teaching learning process.
233
56.0%
Technology greatly enhances the teaching learning process.
106
25.5%
Table T2: Faculty beliefs about the impact of technology on courses
Count
Column N%
Makes a more effective course
302
72.6%
Makes no difference in the effectiveness of a course
42
10.1%
Makes a less effective course
7
1.7%
Has an unknown impact
65
15.6%
Table T3: Faculty use of common technologies (most frequently selected categories shaded)
Once a month or less
A few hours a month
A few hours a week
An hour a day
Several hours a day
Count
%
Count
%
Count
%
Count
%
Count
%
Computer
19
4.8%
15
3.8%
46
11.5%
37
9.3%
282
70.7%
Smart Phone
220
60.6%
42
11.6%
32
8.8%
45
12.4%
24
6.6%
Office Software
31
7.8%
19
4.8%
41
10.3%
82
20.6%
226
56.6%
Email
1
0.2%
19
4.6%
53
12.8%
98
23.7%
243
58.7%
Social Networking
243
68.8%
40
11.3%
40
11.3%
23
6.5%
7
2.0%
Video/Sound Media
105
27.6%
96
25.2%
95
24.9%
53
13.9%
32
8.4%
Table T9: One sample t-test for influence of technology on approaches to grading and assessment
Test Value = 50
t
df
Sig. (2-tailed)
Mean Difference
95% Confidence Interval of the Difference
Lower
Upper
In class tests and quizzes
-4.369
78
.000
-9.74684
-14.1886
-5.3051
Online tests and quizzes
5.624
69
.000
14.77143
9.5313
20.0115
Ungraded assessments
1.176
66
.244
2.17910
-1.5208
5.8790
Formative assessment
5.534
70
.000
9.56338
6.1169
13.0099
Short essays, papers, lab reports, etc.
2.876
70
.005
5.45070
1.6702
9.2312
Extended essays and major projects or performances
1.931
69
.058
3.67143
-.1219
7.4648
Collaborative learning projects
.000
73
1.000
.00000
-4.9819
4.9819
Table T10: Rate the degree to which your role as a faculty member and teacher has changed as a result of increased as a result of increased use of technology
Strongly Disagree
Disagree
Somewhat Disagree
Somewhat Agree
Agree
Strongly Agree
Count
%
Count
%
Count
%
Count
%
Count
%
Count
%
shifting from the role of content expert to one of learning facilitator
12
9.2%
22
16.9%
14
10.8%
37
28.5%
29
22.3%
16
12.3%
your primary role is to provide content for students
14
10.9%
13
10.1%
28
21.7%
29
22.5%
25
19.4%
20
15.5%
your identification with your University is increased
23
18.3%
26
20.6%
42
33.3%
20
15.9%
12
9.5%
3
2.4%
you have less ownership of your course content
26
20.2%
39
30.2%
24
18.6%
21
16.3%
14
10.9%
5
3.9%
your role as a teacher is strengthened
13
10.1%
12
9.3%
26
20.2%
37
28.7%
29
22.5%
12
9.3%
your overall control over your course(s) is diminished
23
17.7%
44
33.8%
30
23.1%
20
15.4%
7
5.4%
6
4.6%
Table T14: One sample t-test for influence of technology on faculty time spent on specific teaching activities
Test Value = 50
t
df
Sig. (2-tailed)
Mean Difference
95% Confidence Interval of the Difference
Lower
Upper
Lecturing
-7.381
88
.000
-12.04494
-15.2879
-8.8020
Preparing course materials
9.246
96
.000
16.85567
13.2370
20.4744
Identifying course materials
8.111
85
.000
13.80233
10.4191
17.1856
Grading / assessing
5.221
87
.000
10.48864
6.4959
14.4813
Course design
12.962
94
.000
21.55789
18.2558
24.8600
Increasing access to materials for all types of learners
In scholarly and scientific publishing, altmetrics are non-traditional metrics[2] proposed as an alternative[3] to more traditional citation impact metrics, such as impact factor and h-index.[4] The term altmetrics was proposed in 2010,[1] as a generalization of article level metrics,[5] and has its roots in the #altmetrics hashtag. Although altmetrics are often thought of as metrics about articles, they can be applied to people, journals, books, data sets, presentations, videos, source code repositories, web pages, etc. They are related to Webometrics, which had similar goals but evolved before the social web. Altmetrics did not originally cover citation counts.[6] It also covers other aspects of the impact of a work, such as how many data and knowledge bases refer to it, article views, downloads, or mentions in social media and news media.[7][8]
++++++++++++++++
more on analytics and metrics in education in this IMS blog
The data shared in June by the Office for Civil Rights, which compiled it from a 2013-2014 survey completed by nearly every school district and school in the United States. new is a report from Attendance Works and the Everyone Graduates Center that encourages schools and districts to use their own data to pinpoint ways to take on the challenge of chronic absenteeism.
The first is research that shows that missing that much school is correlated with “lower academic performance and dropping out.” Second, it also helps in identifying students earlier in the semester in order to get a jump on possible interventions.
The report offers a six-step process for using data tied to chronic absence in order to reduce the problem.
The first step is investing in “consistent and accurate data.” That’s where the definition comes in — to make sure people have a “clear understanding” and so that it can be used “across states and districts” with school years that vary in length. The same step also requires “clarifying what counts as a day of attendance or absence.”
The second step is to use the data to understand what the need is and who needs support in getting to school. This phase could involve defining multiple tiers of chronic absenteeism (at-risk, moderate or severe), and then analyzing the data to see if there are differences by student sub-population — grade, ethnicity, special education, gender, free and reduced price lunch, neighborhood or other criteria that require special kinds of intervention.
Step three asks schools and districts to use the data to identify places getting good results. By comparing chronic absence rates across the district or against schools with similar demographics, the “positive outliers” may surface, showing people that the problem isn’t unstoppable but something that can be addressed for the better.
Steps five and six call on schools and districts to help people understand why the absences are happening, develop ways to address the problem.
More school choice (a.k.a. “open the corporate charter floodgates”).
Merit pay for teachers (a.k.a. “we’ll pay them just what we think they’re worth and they’ll like it”).
End tenure (a.k.a. “You’re fired whenever the mood hits me”).
If Hillary is elected, we can expect more of the Obama style of reform. He deduces this from the advisors who are close to her, mostly from the Center for American Progress.
Bottom line: Trump will run over the schools like a steamroller, flattening them along with their teachers. He endorses vouchers, charters, online charters, anything goes.
Clinton is likely to be akin to Obama/Duncan in advancing charter schools and testing.
Ravitch writes that the “the transfer of public funds to private management and the creation of thousands of deregulated, unsupervised, and unaccountable schools have opened the public coffers to profiteering, fraud, and exploitation by large and small entrepreneurs.”
The public school system, Ravitch argues, is under attack from corporate interests and Wall Street crusaders seeking to make a buck off the American taxpayer. The reformers, Ravitch writes, are an insurgency in America’s schools, “a deliberate effort to replace public education with a privately managed, free-market system of schooling.”
++++++++++++++++++
Accountant Reconsiders Plea in Online Charter School Founder’s Tax Fraud
Social media has the potential to facilitate much closer relationships between libraries and their patrons. Current usage of social media by the library community generally remains ad hoc and somewhat experimental, but the uptake of these tools is accelerating, and they will likely play an increasingly important role in library service provision and outreach in the future. Taylor & Francis has produced a white paper that analyzes current practices relating social media’s use in the library and how this differs by librarian job role. The sample was taken from academic librarians around the world, which also allows us to examine differences by geographic location. The goal: to establish how librarians are currently using social media in their roles, the most useful social media tools and best applications for these tools in a library setting.
explores a variety of social media tools in terms of how they can be used to organize information and communities. Together, you will survey and use a variety of social media tools, such as Delicious, Diigo, Facebook, Goodreads, Google Hangouts, LibraryThing, Pinterest, Storify, Twitter, and more! You will also explore how social media tools can be used to organize and disseminate information and how they can be used to foster and sustain communities of learning.
With the widespread use of library technology that incorporates social media components, intelligent objects, and knowledge-sharing tools comes the ability of libraries to provide greater opportunities for patron engagement in those discovery systems through user-generated content. These features may include the ability of users to contribute commentary such as reviews, simple point-and-click rating systems (e.g. one star to five stars), or to engage in extensive discussions or other social interactions. This kind of content could transform authoritative files, alter information architecture, and change the flow of information within the library discovery system.
Across generations, concerns for privacy may dissipate with time as specific technologies take hold or as people become aware of a technology’s benefits and value those over their value for privacy.
Library Privacy Guidelines for Students in K-12 Schools
On Facebook, go to Insights > Posts > Post Types to review the engagement by the type of content you posted (post, link, image, video). On Twitter, you can see a snapshot of each post you’ve made by going to Settings > Analytics > Tweets.
#2: Fine-tune Your Posting Schedule
On Facebook, go to Insights > Posts > When Your Fans Are Online. For Twitter, you can use a tool such a Tweriod to find out when the bulk of your followers are online.
#3: Inform Your Messaging
On Facebook, open the Ads Manager and go to Audience Insights. On Twitter, you can check your audience data by going to Settings > Twitter Ads > Analytics > Audience Insights.
#4: Boost Your Engagement
On Twitter, go to Settings > Analytics > Tweets and take a look at which post topics get the most engagement. On Facebook, go to Insights > Posts > Post Types and then switch the engagement metrics in Facebook to show reactions, comments, and shares for each post rather than post clicks or general engagement.
If you think it’s important to quote something, an excellent rule of thumb is that for every line you quote, you should have at least two lines analyzing it.
DO NOT USE DIRECT QUOTES From Published Material: In 99.99% of the cases, the information you want from a research article is an objective result or interpretation. How the author stated this information, i.e., their prose, is of little importance compared to the results or interpretations themselves. Take the information and put it into your own words; avoid paraphrasing since this can potentially lead to plagiarism.
Quote no more material than is necessary; if a short phrase from a source will suffice, don’t quote an entire paragraph
Use quotes that will have the most rhetorical, argumentative impact in your paper; too many direct quotes from sources may weaken your credibility, as though you have nothing to say yourself, and will certainly interfere with your style
p. 1 definition of social media for libraries
six primarytypes exist: “collaborative projects, blogs, content communities, social networking sites,” and two types of virtual worlds: “virtual game worlds, which ask users to follow the rules of the game, and virtual social worlds, wherein users can behave without rules in almost any way they like” (Kaplan and Haenlein, 2010: 59) it is not that I disagree with such definition, but i wish there was a “door” mentioning “flexibility” and “necessity to reassess” what social media is every year, 3 year, 5 years
p. 2 definition what is strategic planning
identify the needs of your target audiences,
identify the ways in which you can meet those needs, and
identify ways to respond confidently and proactively to changesin those needs.
Where the organization is
Where the organization should go
How the organization can get there (McNamara, 2011)
It must be:
Flexible
Based on data
Maintainable
Regularly cared for
covers and confirms my notes to the SCSU library use of its social media:
p. 83 ask uncomfortable questions
in planning, we must be prepared to ask, critically consider and answer questions that make us uncomfortable (not only that I was not let to ask questions, I was ousted from any body that was making decisions regarding social media. I was openly opposed and rebuked for asking why 3 reference librarians will keep the passwords to the account for the library SM)
p. 83 Communicate
If your team communicates honestly and thoroughly, then positive feelings and advocates for your social media endeavors will grow. In the span of 6 months, I had to ask three times where are the notes of the social media committee kept and eventually i will receive an answer, which in it nebulous and apologetic form was practically not an answer.
p. 83 Don’t rush to conclusions
Satisficing often works, but it can also lead to conclusions that are less then optimal. In the fall of 2013, I had to fight an overwhelming majority opposing my proposal that social media needs to include student representation, since SM is about dialog, not broadcasting (see page 86) and the current staff and faculty see SM as another form of broadcasting. In the span of six months, by the summer of 2014 library staff and faculty had fallen in the other extreme, letting one single student run all library SM. That student did/could not have understanding of the scope and goals of the library resulting in satisficing.
p. 84 aim for consensus, but don’t require it Consensus was the leitmotiv of the dean; it failed in general, and it failed in SM.
p. 84 get an external reviewer
p. 84 value and celebrate small success
a strategic plan will be realized through a series of small actions, not one or two pivotal plots.
p. 84 create accountability
p. 86 maintain a consistent tone and brand
visual and tone based consistency. This library DOES maintain consistency by posting Instagram pictures of people covering their faces with books, so part of their face compliments a face on cover of books. It is done by other libraries and it would have been cute and original if not overdone. If the SM activities of a library consist mostly of such activities then the “branding” part definitely is hurt. Yet, the faculty in this library vehemently adhere to “let’s see what other libraries are doing,” but does not understand that it needs further conceptualizing to figure out how to transform into “brand.”
p. 86 capitalize on the strengths of social media
“in many cases, business and libraries use SM exactly as they use their websites: to push content. This has been the main criticism from the start: the three reference librarians holding the passwords to the SM account were using Facebook as a announcement board and kept dormant the other accounts. The resolution of the library faculty who was called to arbitrate the argument with these three librarian: “I don’t understand very well Facebook.” The interim dean, who, subsequently had to resolve this dispute: “I don’t use Facebook.”
p. 87 Metrics
Analyze and tweak plan
measuring success is about maximizing time and efforts, not about laying blame for shortcomings or failures. this applies to daily tasks and responsibilities and shuffling time, but when the organization does not have a clear overarching goal and clear strategy how to achieve it, then issues must be raised up. which leads to:
p. 92 Plan for conversation
the inclusion of conversation. incorporate your patrons as primary content creators (not appointing just a single student worker to broadcast)
p. 92 use SM as an assessment or feedback tool
p. 93 plan to monitor your brand
if you decide to start watching these types of mentions, you’ll want to consider whether you’ll adopt a passive or an active role in responding to them.
Revenues for self-paced e-learning in 2016 are heavily concentrated in two countries — the United States and China. The growth rate in the U.S. is at -5.3 percent, representing a $4.9 billion drop in revenues by 2021, while in China, the rate is at -8.8 percent, representing a $1.9 billion drop by 2021. The e-learning market in China has deteriorated rapidly in just the last 18 months, the report said.
Of the 122 countries tracked by Ambient Insight, 15 have growth rates for self-paced e-learning over 15 percent during the next five years. These countries are heavily concentrated in Asia and Africa, with the two outliers being Slovakia and Lithuania.
Eleven of the top 15 growth countries will generate less than $20 million by 2021. Of the top 15, Slovakia and Lithuania are anticipated to generate the highest revenues for self-paced products by 2021, at $55.4 million and $36.5 million, respectively.
The growth rates are negative in every region except Africa, where the growth is flat at 0.9 percent. The steepest declines are in Asia and Latin America at -11.7 percent and -10.8 percent, respectively. The economic meltdowns in Brazil and Venezuela are major inhibitors in Latin America.
There are 77 countries with flat-to-negative growth rates. The countries with the lowest growth rates are Yemen (-18.7 percent), Brazil (-19.8 percent), Qatar (-23.5 percent) and Venezuela (-26.8 percent).
Self-paced e-learning products include online courses, managed education services, managed training, e-books and learning management systems, according to the report. The author does not consider mobile and game-based learning, which are growing, to be in the self-paced e-learning category.
The news on the self-paced e-learning industry is so bad, Ambient Insight will no longer publish commercial syndicated reports on the industry, the firm says on its website and in the report.
W3Schools – Fantastic set of interactive tutorials for learning different languages. Their SQL tutorial is second to none. You’ll learn how to manipulate data in MySQL, SQL Server, Access, Oracle, Sybase, DB2 and other database systems.
Treasure Data – The best way to learn is to work towards a goal. That’s what this helpful blog series is all about. You’ll learn SQL from scratch by following along with a simple, but common, data analysis scenario.
10 Queries – This course is recommended for the intermediate SQL-er who wants to brush up on his/her skills. It’s a series of 10 challenges coupled with forums and external videos to help you improve your SQL knowledge and understanding of the underlying principles.
TryR – Created by Code School, this interactive online tutorial system is designed to step you through R for statistics and data modeling. As you work through their seven modules, you’ll earn badges to track your progress helping you to stay on track.
Leada – If you’re a complete R novice, try Lead’s introduction to R. In their 1 hour 30 min course, they’ll cover installation, basic usage, common functions, data structures, and data types. They’ll even set you up with your own development environment in RStudio.
Advanced R – Once you’ve mastered the basics of R, bookmark this page. It’s a fantastically comprehensive style guide to using R. We should all strive to write beautiful code, and this resource (based on Google’s R style guide) is your key to that ideal.
Swirl – Learn R in R – a radical idea certainly. But that’s exactly what Swirl does. They’ll interactively teach you how to program in R and do some basic data science at your own pace. Right in the R console.
Python for beginners – The Python website actually has a pretty comprehensive and easy-to-follow set of tutorials. You can learn everything from installation to complex analyzes. It also gives you access to the Python community, who will be happy to answer your questions.
PythonSpot – A complete list of Python tutorials to take you from zero to Python hero. There are tutorials for beginners, intermediate and advanced learners.
Read all about it: data mining books
Data Jujitsu: The Art of Turning Data into Product – This free book by DJ Patil gives you a brief introduction to the complexity of data problems and how to approach them. He gives nice, understandable examples that cover the most important thought processes of data mining. It’s a great book for beginners but still interesting to the data mining expert. Plus, it’s free!
Data Mining: Concepts and Techniques – The third (and most recent) edition will give you an understanding of the theory and practice of discovering patterns in large data sets. Each chapter is a stand-alone guide to a particular topic, making it a good resource if you’re not into reading in sequence or you want to know about a particular topic.
Mining of Massive Datasets – Based on the Stanford Computer Science course, this book is often sighted by data scientists as one of the most helpful resources around. It’s designed at the undergraduate level with no formal prerequisites. It’s the next best thing to actually going to Stanford!
Big Data, Data Mining, and Machine Learning: Value Creation for Business Leaders and Practitioners – This book is a must read for anyone who needs to do applied data mining in a business setting (ie practically everyone). It’s a complete resource for anyone looking to cut through the Big Data hype and understand the real value of data mining. Pay particular attention to the section on how modeling can be applied to business decision making.
Hadoop: The Definitive Guide – As a data scientist, you will undoubtedly be asked about Hadoop. So you’d better know how it works. This comprehensive guide will teach you how to build and maintain reliable, scalable, distributed systems with Apache Hadoop. Make sure you get the most recent addition to keep up with this fast-changing service.
Online learning: data mining webinars and courses
DataCamp – Learn data mining from the comfort of your home with DataCamp’s online courses. They have free courses on R, Statistics, Data Manipulation, Dynamic Reporting, Large Data Sets and much more.
Coursera – Coursera brings you all the best University courses straight to your computer. Their online classes will teach you the fundamentals of interpreting data, performing analyzes and communicating insights. They have topics for beginners and advanced learners in Data Analysis, Machine Learning, Probability and Statistics and more.
Udemy – With a range of free and pay for data mining courses, you’re sure to find something you like on Udemy no matter your level. There are 395 in the area of data mining! All their courses are uploaded by other Udemy users meaning quality can fluctuate so make sure you read the reviews.
CodeSchool – These courses are handily organized into “Paths” based on the technology you want to learn. You can do everything from build a foundation in Git to take control of a data layer in SQL. Their engaging online videos will take you step-by-step through each lesson and their challenges will let you practice what you’ve learned in a controlled environment.
Udacity – Master a new skill or programming language with Udacity’s unique series of online courses and projects. Each class is developed by a Silicon Valley tech giant, so you know what your learning will be directly applicable to the real world.
Treehouse – Learn from experts in web design, coding, business and more. The video tutorials from Treehouse will teach you the basics and their quizzes and coding challenges will ensure the information sticks. And their UI is pretty easy on the eyes.
Learn from the best: top data miners to follow
John Foreman – Chief Data Scientist at MailChimp and author of Data Smart, John is worth a follow for his witty yet poignant tweets on data science.
DJ Patil – Author and Chief Data Scientist at The White House OSTP, DJ tweets everything you’ve ever wanted to know about data in politics.
Nate Silver – He’s Editor-in-Chief of FiveThirtyEight, a blog that uses data to analyze news stories in Politics, Sports, and Current Events.
Andrew Ng – As the Chief Data Scientist at Baidu, Andrew is responsible for some of the most groundbreaking developments in Machine Learning and Data Science.
Bernard Marr – He might know pretty much everything there is to know about Big Data.
Gregory Piatetsky – He’s the author of popular data science blog KDNuggets, the leading newsletter on data mining and knowledge discovery.
Christian Rudder – As the Co-founder of OKCupid, Christian has access to one of the most unique datasets on the planet and he uses it to give fascinating insight into human nature, love, and relationships
Dean Abbott – He’s contributed to a number of data blogs and authored his own book on Applied Predictive Analytics. At the moment, Dean is Chief Data Scientist at SmarterHQ.
Practice what you’ve learned: data mining competitions
Kaggle – This is the ultimate data mining competition. The world’s biggest corporations offer big prizes for solving their toughest data problems.
Stack Overflow – The best way to learn is to teach. Stackoverflow offers the perfect forum for you to prove your data mining know-how by answering fellow enthusiast’s questions.
TunedIT – With a live leaderboard and interactive participation, TunedIT offers a great platform to flex your data mining muscles.
DrivenData – You can find a number of nonprofit data mining challenges on DataDriven. All of your mining efforts will go towards a good cause.
Quora – Another great site to answer questions on just about everything. There are plenty of curious data lovers on there asking for help with data mining and data science.
Meet your fellow data miner: social networks, groups and meetups
Facebook – As with many social media platforms, Facebook is a great place to meet and interact with people who have similar interests. There are a number of very active data mining groups you can join.
LinkedIn – If you’re looking for data mining experts in a particular field, look no further than LinkedIn. There are hundreds of data mining groups ranging from the generic to the hyper-specific. In short, there’s sure to be something for everyone.
Meetup – Want to meet your fellow data miners in person? Attend a meetup! Just search for data mining in your city and you’re sure to find an awesome group near you.
Data storytelling is the realization of great data visualization. We’re seeing data that’s been analyzed well and presented in a way that someone who’s never even heard of data science can get it.
Google’s Cole Nussbaumer provides a friendly reminder of what data storytelling actually is, it’s straightforward, strategic, elegant, and simple.