Arshad, M., & Akram, M. S. (2018). Social Media Adoption by the Academic Community: Theoretical Insights and Empirical Evidence From Developing Countries.
The International Review of Research in Open and Distributed Learning,
19(3). Retrieved from
http://www.irrodl.org/index.php/irrodl/article/view/3500
Building on the social constructivist paradigm and technology acceptance model, we propose a conceptual model to assess social media adoption in academia by incorporating collaboration, communication, and resource sharing as predictors of social media adoption, whereas perceived ease of use and perceived usefulness act as mediators in this relationship.
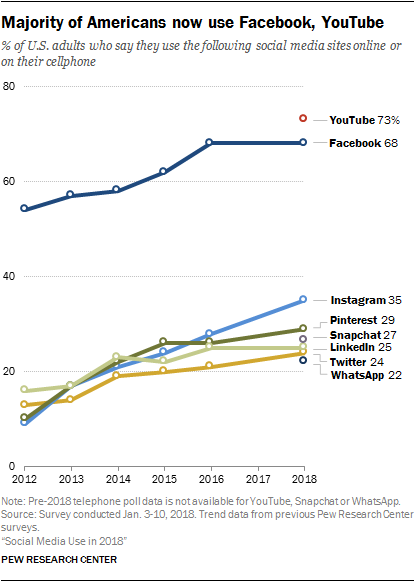
According to the latest social media statistics, there are more than 2 billion Facebook users, more than 300 million Twitter users, more than 500 million Google+ users, and more than 400 million LinkedIn users (InternetLiveStats, 2018).
although social media is rapidly penetrating into the society, there is no consensus in the literature on the drivers of social media adoption in an academic context. Moreover, it is not clear how social media can impact academic performance.
Social media platforms have significant capability to support the social constructivist paradigm that promotes collaborative learning (Vygotsky, 1978).
+++++++++++++
- Perceived usefulness (PU) – This was defined by Fred Davis as “the degree to which a person believes that using a particular system would enhance his or her job performance“.
- Perceived ease-of-use (PEOU) – Davis defined this as “the degree to which a person believes that using a particular system would be free from effort” (Davis 1989).
Venkatesh, V., Morris, M. G., Davis, G. B., & Davis, F. D. (2003). USER ACCEPTANCE OF INFORMATION TECHNOLOGY: TOWARD A UNIFIED VIEW. MIS Quarterly, 27(3), 425-478.
http://login.libproxy.stcloudstate.edu/login?qurl=http%3a%2f%2fsearch.ebscohost.com%2flogin.aspx%3fdirect%3dtrue%26db%3daph%26AN%3d10758835%26site%3dehost-live%26scope%3dsite
++++++++++++++
proposing a Social Media Adoption Model (SMAM) for the academic community
Social media platforms provide an easy alternative, to the academic community, as compared to official communications such as email and blackboard. my note: this has been established as long as back as in 2006 – https://www.chronicle.com/article/E-Mail-is-for-Old-People/4169. Around the time, when SCSU announced email as the “formal mode of communication).Thus, it is emerging as a new communication and collaboration tool among the academic community in higher education institutions (Roblyer, McDaniel, Webb, Herman, & Witty, 2010). Social media has greatly changed the communication/feedback environment by introducing technologies that have modified the educational perspective of learning and interacting (Prensky, 2001).
++++++++++++++
Theory of Reasoned Action : https://en.wikipedia.org/wiki/Theory_of_reasoned_action
++++++++++++++++++++
the Theory of Reasoned Action (Fishbein & Ajzen, 1975) and the Technology Acceptance Model (Davis, 1989) have been used to assess individuals’ acceptance and use of technology. According to the Technology Acceptance Model, perceived usefulness and perceived ease are the main determinants of an individual’s behavioral intentions and actual usage (Davis, 1989).
Perceived usefulness, derived from the Technology Acceptance Model (TAM), is the particular level that an individual perceives that they can improve their job performance or create ease in attaining the targeted goals by using an information system. It is also believed to make an individual free from mental pressure (Davis, 1989).
Perceived ease of use can be defined as the level to which an individual believes that using a specific system will make a task easier (Gruzd, Staves, & Wilk, 2012) and will reduce mental exertion (Davis, 1989). Venkatesh (2000) posits this construct as a vital element in determining a user’s behavior toward technology. Though generally, there is consensus on the positive effect of perceived ease of use and perceived usefulness on users’ attitude towards social media, it is not yet clear which one of these is more relevant in explaining users’ attitude towards social media in the academic community (Lowry, 2002). Perceived ease of use is one of the eminent behavioral beliefs affecting the users’ intention toward technology acceptance (Lu et al., 2005). The literature suggests that perceived ease of use of technology develops a positive attitude toward its usage (Davis, 1989).
Collaborative learning is considered as an essential instructional method as it assists in overcoming the communication gap among the academic community (Bernard, Rubalcava, & St-Pierre, 2000). The academic community utilizes various social media platforms with the intention to socialize and communicate with others and to share common interests (Sánchez et al., 2014; Sobaih et al., 2016). The exchange of information through social media platforms help the academic community to develop an easy and effective communication among classmates and colleagues (Kaplan & Haenlein, 2010). Social media platforms can also help in developing communities of practice that may help improve collaboration and communication among members of the community (Sánchez et al., 2014). Evidence from previous work confirms that social media platforms are beneficial to college and university students for education purposes (Forkosh-Baruch & Hershkovitz, 2012). Due to the intrinsic ease of use and usefulness of social media, academics are regularly using information and communication technologies, especially social media, for collaboration with colleagues in one way or the other (Koh & Lim, 2012; Wang, 2010).
++++++++++++++++
more about social media in education in this IMS blog
https://blog.stcloudstate.edu/ims?s=social+media+education
Sugimoto, C. R., Work, S., Larivière, V., & Haustein, S. (2016). Scholarly use of social media and altmetrics: a review of the literature. Retrieved from
https://arxiv.org/abs/1608.08112
One of the central issues associated with altmetrics (short for alternative metrics) is the identification of communities engaging with scholarly content on social media (Haustein, Bowman, & Costas, 2015; Neylon, 2014; Tsou, Bowman, Ghazinejad, & Sugimoto, 2015) . It is thus of central importance to understand the uses and users of social media in the context of scholarly communication.
most identify the following major categori es: social networking, social bookmarking, blogging, microblogging, wikis , and media and data sharing (Gu & Widén -Wulff, 2011; Rowlands, Nicholas, Russell, Canty, & Watkinson, 2011; Tenopir et al., 2013) . Some also conside r conferencing, collaborative authoring, scheduling and meeting tools (Rowlands et al., 2011) or RSS and online documents (Gu & Widén -Wulff, 2011; Tenopir et al., 2013) as social media. The landscape of social media, as well as that of altmetrics, is constantly changing and boundaries with othe r online platforms and traditional metrics are fuzzy. Many online platforms cannot be easily classified and more traditional metrics , such as downloads and mentions in policy documents , have been referred to as altmetrics due to data pr ovider policies.
the Use of social media platforms for by researchers is high — ranging from 75 to 80% in large -scale surveys (Rowlands et al., 2011; Tenopir et al., 2013; Van Eperen & Marincola, 2011) .
but
less than 10% of scholars reported using Twitter (Rowlands et al., 2011) , while 46% used ResearchGate (Van Noorden, 2014) , and more than 55% use d YouTube (Tenopir et al., 2013) —it is necessary to discuss the use of various types of social media separately . Furthermore, there i s a distinction among types of us e, with studies showing higher uses of social media for dissemination, consumption, communication , and promotion (e.g., Arcila -Calderón, Piñuel -Raigada, & Calderín -Cruz, 2013; Van Noorden, 2014) , and fewer instances of use for creation (i.e., using social media to construct scholarship) (British Library et al., 2012; Carpenter, Wetheridge, Tanner, & Smith, 2012; Procter et al., 2010b; Tenopir et al., 2013) .
Frequently mentioned social platforms in scholarly communication research include research -specific tools such as Mendeley, Zotero, CiteULike, BibSonomy, and Connotea (now defunct) as well as general tools such as Delicious and Digg (Hammond, Hannay, Lund, & Scott, 2005; Hull, Pettifer, & Kell, 2008; Priem & Hemminger, 2010; Reher & Haustein, 2010) .
Social data sharing platforms provide an infrastructure to share various types of scholarly objects —including datasets, software code, figures, presentation slides and videos —and for users to interact with these objects (e.g., comment on, favorite, like , and reuse ). Platforms such as Figshare and SlideShare disseminate scholars’ various types of research outputs such as datasets, figures, infographics, documents, videos, posters , or presentation slides (Enis, 2013) and displays views, likes, and shares by other users (Mas -Bleda et al., 2014) . GitHub provides for uploading and stor ing of software code, which allows users to modify and expand existing code (Dabbish, Stuart, Tsay, & Herbsleb, 2012) , which has been shown to lead to enhanced collaboratio n among developers (Thung, Bissyande, Lo, & Jiang, 2013) . As w ith other social data sharing platforms, usage statistics on the number of view and contributions to a project are provided (Kubilius, 2014) . The registry of research data repositories, re3data.org, ha s indexed more than 1,200 as of May 2015 2 . However, only a few of these repositories (i.e. , Figshare, SlideShare and Github) include social functionalities and have reached a certain level of participation from scholars (e.g., Begel, Bosch, & Storey, 2013; Kubilius, 2014) .
Video provide s yet another genre for social interaction and scholarly communication (Kousha, Thelwall, & Abdoli, 2012; Sugimoto & Thelwall, 2013) . Of the various video sharing platforms, YouTube, launched in 2005, is by far the most popular
A study of UK scholars reports that the majority o f respondents engaged with video for scholarly communication purposes (Tenopir et al., 2013) , yet only 20% have ever created in that genre. Among British PhD students, 17% had used videos and podcasts passively for research, while 8% had actively contributed (British Library et al., 2012) .
Blogs began in the mid -1990s and were considered ubiquitous by the mid- 200 0s (Gillmor, 2006; Hank, 2011; Lenhart & Fox, 2006; Rainie, 2005) . Scholarly blogs emerged during this time with their own neologisms (e.g., blogademia , blawgosphere , bloggership) and body of research (Hank, 2011) and were considered to change the exclusive structure of scholarly communication
Technorati, considered t o be on e of the largest ind ex of blogs, deleted their entire blog directory in 2014 3 . Individual blogs are also subject to abrupt cancellations and deletions, making questionable the degree to which blogging meets the permanence criteria of scholarly commu nication (Hank, 2011) .
ResearchBlogging.org (RB) — “an aggregator of blog posts referencing peer -reviewed research in a structured manner” (Shema, Bar -Ilan, & Thelwall, 2015, p. 3) — was launched in 2007 and has been a fairly stable structure in the scholarly blogging environment. RB both aggregates and —through the use of the RB icon — credentials scholarly blogs (Shema et al., 2015) . The informality of the genre (Mewburn & Thomson, 2013) and the ability to circumve nt traditional publishing barr iers has led advocates to claim that blogging can invert traditional academic power hierarchies (Walker, 2006) , allow ing people to construct scholarly identities outside of formal institutionalization (Ewins, 2005; Luzón, 2011; Potter, 2012) and democratize the scientific system (Gijón, 2013) . Another positive characteristic of blogs is their “inherently social” nature (Walker, 2006, p. 132) (see also Kjellberg, 2010; Luzón, 2011 ). Scholars have noted the potential for “communal scholarship” (Hendrick, 2012) made by linking and commenting, calling the platform “a new ‘third place’ for academic discourse” (Halavais, 2006, p. 117) . Commenting functionalities were seen as making possible the “shift from public understanding to public engagement with science” (Kouper, 2010, p. 1) .
Studies have also provided evidence of high rate s of blogging among certain subpopulations: for example, approximately one -third of German university staff (Pscheida et al., 2013) and one fifth of UK doctoral students use blogs (Carpenter et al., 2012) .
Academics are not only producers, but also consumers of blogs: a 2007 survey of medical bloggers foundthat the large majority (86%) read blogs to find medical news (Kovic et al., 2008)
Mahrt and Puschmann (2014) , who defined science blogging as “the use of blogs for science communication” (p. 1). It has been similarly likened to a sp ace for public intellectualism (Kirkup, 2010; Walker, 2006) and as a form of activism to combat perceived biased or pseudoscience (Riesch & Mendel, 2014. Yet, there remains a tension between science bloggers and science journalists, with many science journals dismissing the value of science blogs (Colson, 2011)
.
while there has been anecdotal evidence of the use of blogs in promotion and tenure (e.g., (Podgor, 2006) the consensus seem s to suggest that most institutions do not value blogging as highly as publishing in traditional outlets, or consider blogging as a measure of service rather than research activity (Hendricks, 2010, para. 30) .
Microblogging developed out of a particular blogging practice, wherein bloggers would post small messages or single files on a blog post. Blogs that focused on such “microposts” were then termed “tumblelogs” and were described as “a quick and dirty stream of consciousness” kind of blogging (Kottke, 2005, para. 2)
most popular microblogs are Twitter (launched in 2006), tumblr (launched in 2007), FriendFeed (launched in 2007 and available in several languages), Plurk (launched in 2008 and popular in Taiwan), and Sina Weibo (launched in 2009 and popular in China).
users to follow other users, search tweets by keywords or hashtags, and link to other media or other tweets
.
Conference chatter (backchanneling) is another widely studied area in the realm of scholarly microblogging. Twitter use at conferences is generally carried out by a minority of participants
Wikis are collaborative content management platforms enabled by web browsers and embedded markup languages.
Wikipedia has been advocated as a replacement for traditional publishing and peer review models (Xia o & Askin, 2012) and pleas have been made to encourage experts to contribute (Rush & Tracy, 2010) . Despite this, contribution rates remain low — likely hindered by the lack of explicit authorship in Wikipedia, a cornerstone of the traditional academic reward system (Black, 2008; Butler, 2008; Callaway, 2010; Whitworth & Friedman, 2009) . Citations to scholarly documents —another critical component in the reward system —are increasingly being found i n Wikiped ia entries (Bould et al., 2014; Park, 2011; Rousidis et al., 2013) , but are no t yet seen as valid impact indicators (Haustein, Peters, Bar -Ilan, et al., 2014) .
The altmetrics manifesto (Priem et al., 2010, para. 1) , altmetrics can serve as filters , which “reflect the broad, rapid impact of scholarship in this burgeoning ecosystem”.
There are also a host of platforms which are being used informally to discuss and rate scholarly material. Reddit, for example, is a general topic platform where users can submit, discuss and rate online content. Historically, mentions of scientific journals on Reddit have been rare (Thelwall, Haustein, et al., 2013) . However, several new subreddits —e.g., science subreddit 4 , Ask Me Anything sessions 5 –have recently been launched, focusing on the discussion of scientific information. Sites like Amazon (Kousha & Thelwall, 2015) and Goodreads (Zuccala, Verleysen, Cornacchia, & Engels, 2015) , which allow users to comment on and rate books, has also been mined as potential source for the compilation of impact indicators
libraries provide services to support researchers’ use of social media tools and metrics (Lapinski, Piwowar, & Priem, 2013; Rodgers & Barbrow, 2013; Roemer & Borchardt, 2013). One example is
Mendeley Institutional Edition,
https://www.elsevier.com/solutions/mendeley/Mendeley-Institutional-Edition, which mines Mendeley documents, annotations, and behavior and provides these data to libraries (Galligan & Dyas -Correia, 2013) . Libraries can use them for collection management, in a manner similar to other usage data, such as COUNTER statistics (Galligan & Dyas -Correia, 2013) .
Factors affecting social media use; age, academic rank and status, gender, discipline, country and language,
++++++++++++++++++++++++++
h-index
+++++++++++++
more on altmetrics in this IMS blog:
https://blog.stcloudstate.edu/ims?s=altmetrics
How to Successfully Mine Your Social Media Data
by Alex York on June 22, 2016
http://sproutsocial.com/insights/social-media-data/
social media has a strong return on investment (ROI) – how to
Social media data is the collected information from social networks that show how users share, view or engage with your content or profiles. These numbers, percentages and statistics provide better insights into your social media strategy.
social media analytics to make sense of the raw information.
media data as the ingredients to your meal and the analysis as your recipe. Without the recipe, you wouldn’t know what to make or how to cook it.
Some of the raw social media data can include:
- Shares
- Likes
- Mentions
- Impressions
- Hashtag usage
- URL clicks
- Keyword analysis
- New followers
- Comments
Key performance indicators (KPIs) are the various business metrics used to measure and analyze certain aspects of your business. Social media KPIs are the metrics that likely factor into your social media ROI.
Facebook business page, you can analyze some KPIs within the social network. The most essential Facebook metrics include (see entire article).
Twitter Analytics
- Engagement Rate: Total link clicks, Retweets, favorites and replies on your Tweet divided by total impressions.
- Followers: Total number of Twitter followers.
- Link Clicks: Total number of URL and hashtag links clicked.
- Mentions: How many times your @username was mentioned by others.
- Profile Visits: Total Twitter profile visits.
- Replies: How many times people replied to your Tweets.
- Retweets: Total Retweets received by others.
- Tweet Impressions: Total of times your Tweet has been viewed whether it was clicked or not.
- Tweets: How many Tweets you’ve posted.
LinkedIn Analytics
Here are the top LinkedIn metrics:
- Clicks: Total clicks on a post, company name or logo.
- Engagement: Total interactions divided by number of impressions.
- Followers: Total number of new followers through a sponsored update.
- Impressions: Total times your update was visible to other users.
- Interactions: Total number of comments, likes, comments and shares.
Google Analytics
- Average Session Duration: Average session times users spend on your site.
- Bounce Rate: Percentage of users leaving your site after one page view.
- New Users: Total number of new users coming to your site for the first time.
- Pages / Session: Average number of pages a user views each session.
- Pageviews: Number of pages loaded or reloaded in a browser.
- Sessions: Total times when users are active on your site.
need to decipher what’s most important.
If you wanted to track audience growth on Facebook, consider engagement rates, new followers, Post reach and organic Likes.
For example, if you launched a social media campaign, track data that highlights your ROI. According to Mashable, your ROI cycle for a social media campaign should be set up in three stages:
- Launch
- Management
- Optimization
41% of companies and agencies no clue about their social media financial impact. It’s nearly impossible to figure out data overnight. Instead, it takes months of tracking to ensure your future business decisions are valuable.
Sprout’s suite of social media analytics tools give you presentation-ready reports on major social networks.
++++++++++++++
more on social media analytics:
https://blog.stcloudstate.edu/ims?s=social+media+analytics
more on social media stats in this IMS blog
https://blog.stcloudstate.edu/ims?s=social+media+statistics