05
May
2022
May
2022
Computational Thinking and Data Analysis
categories: Digital literacy
https://www.iste.org/explore/computational-thinking-and-data-analysis-go-hand-hand
Digital Literacy for St. Cloud State University
https://www.iste.org/explore/computational-thinking-and-data-analysis-go-hand-hand
Bibliographic Analysis for Graduate Students, EDAD 518, Fri/Sat, May 15/16, 2020
This session will not be about qualitative research (QR) only, but rather about a modern 21st century approach toward the analysis of your literature review in Chapter 2.
However, the computational approach toward qualitative research is not much different than computational approach for your quantitative research; you need to be versed in each of them, thus familiarity with nVivo for qualitative research and with SPSS for quantitative research should be pursued by any doctoral student.
Qualitative Research
Here a short presentation on the basics:
https://blog.stcloudstate.edu/ims/2019/03/25/qualitative-analysis-basics/
Further, if you wish to expand your knowledge, on qualitative research (QR) in this IMS blog:
https://blog.stcloudstate.edu/ims?s=qualitative+research
Workshop on computational practices for QR:
https://blog.stcloudstate.edu/ims/2017/04/01/qualitative-method-research/
Here is a library instruction session for your course
https://blog.stcloudstate.edu/ims/2020/01/24/digital-literacy-edad-828/
Once you complete the overview of the resources above, please make sure you have Zotero working on your computer; we will be reviewing the Zotero features before we move to nVivo.
Here materials on Zotero collected in the IMS blog:
https://blog.stcloudstate.edu/ims?s=zotero
Of those materials, you might want to cover at least:
Familiarity with Zotero is a prerequisite for successful work with nVivo, so please if you are already working with Zotero, try to expand your knowledge using the materials above.
nVivo
https://blog.stcloudstate.edu/ims/2017/01/11/nvivo-shareware/
Please use this link to install nVivo on your computer. Even if we were not in a quarantine and you would have been able to use the licensed nVivo software on campus, for convenience (working on your dissertation from home), most probably, you would have used the shareware. Shareware is fully functional on your computer for 14 days, so calculate the time you will be using it and mind the date of installation and your consequent work.
For the purpose of this workshop, please install nVivo on your computer early morning on Saturday, May 16, so we can work together on nVivo during the day and you can continue using the software for the next two weeks.
Please familiarize yourself with the two articles assigned in the EDAD 815 D2L course content “Practice Research Articles“ :
Brosky, D. (2011). Micropolitics in the School: Teacher Leaders’ Use of Political Skill and Influence Tactics. International Journal of Educational Leadership Preparation, 6(1). https://eric.ed.gov/?id=EJ972880
Tooms, A. K., Kretovics, M. A., & Smialek, C. A. (2007). Principals’ perceptions of politics. International Journal of Leadership in Education, 10(1), 89–100. https://doi.org/10.1080/13603120600950901
It is very important to be familiar with the articles when we start working with nVivo.
++++++++++++++++
https://blog.stcloudstate.edu/ims/2020/01/27/zotero-workshop/
++++++++++++++++
The following guideline is based on this document:
whereas the snapshots are replaced with snapshots from nVivol, version 12, which we will be using in our course and for our dissertations.
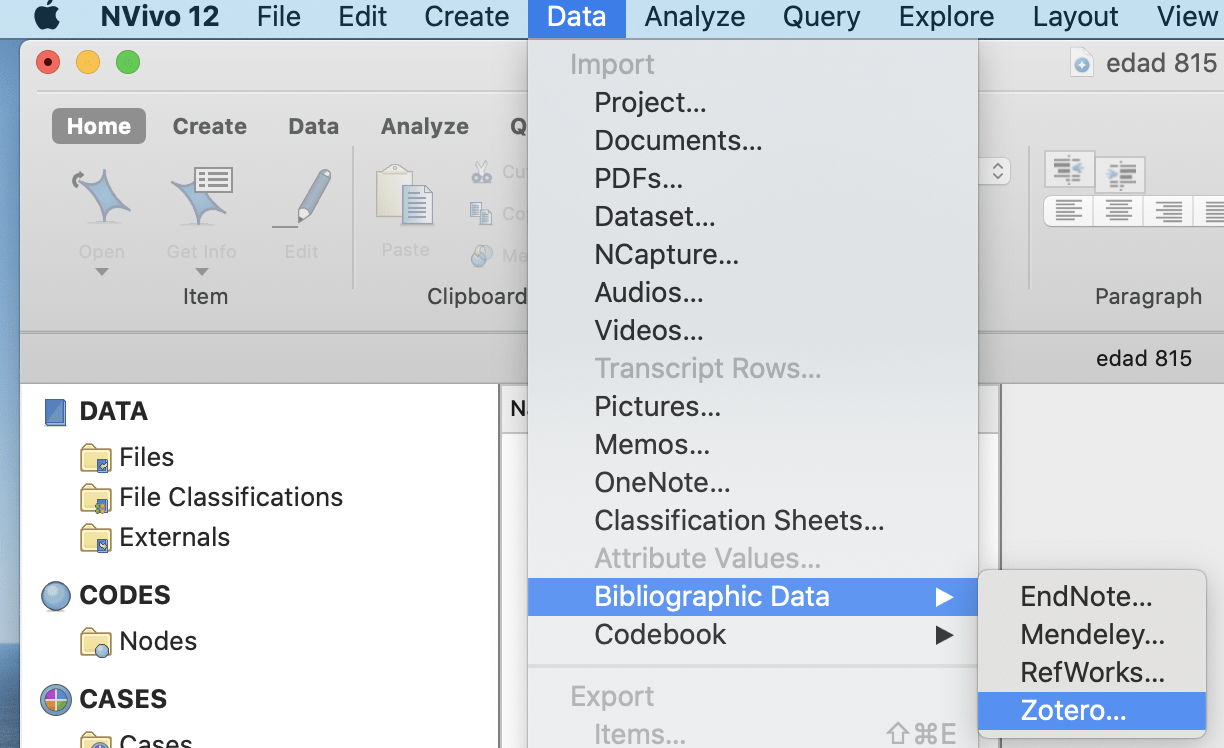
Bibliographic Data is an organized collection of references to publish in literature that includes journals, magazine articles, newspaper articles, conference proceedings, reports, government and legal publications. The bibliographical data is important for writing the literature review of a research. This data is usually saved and organized in databases like Mendeley or Endnote. Nvivo provides the option to import bibliographical data from these databases directly. One can import End Note library or Mendeley library into Nvivo. Similar to interview transcripts, one can represent and analyze bibliographical data using Nvivo. To start with bibliographical data representation, this article previews the processing of literature review in Nvivo.
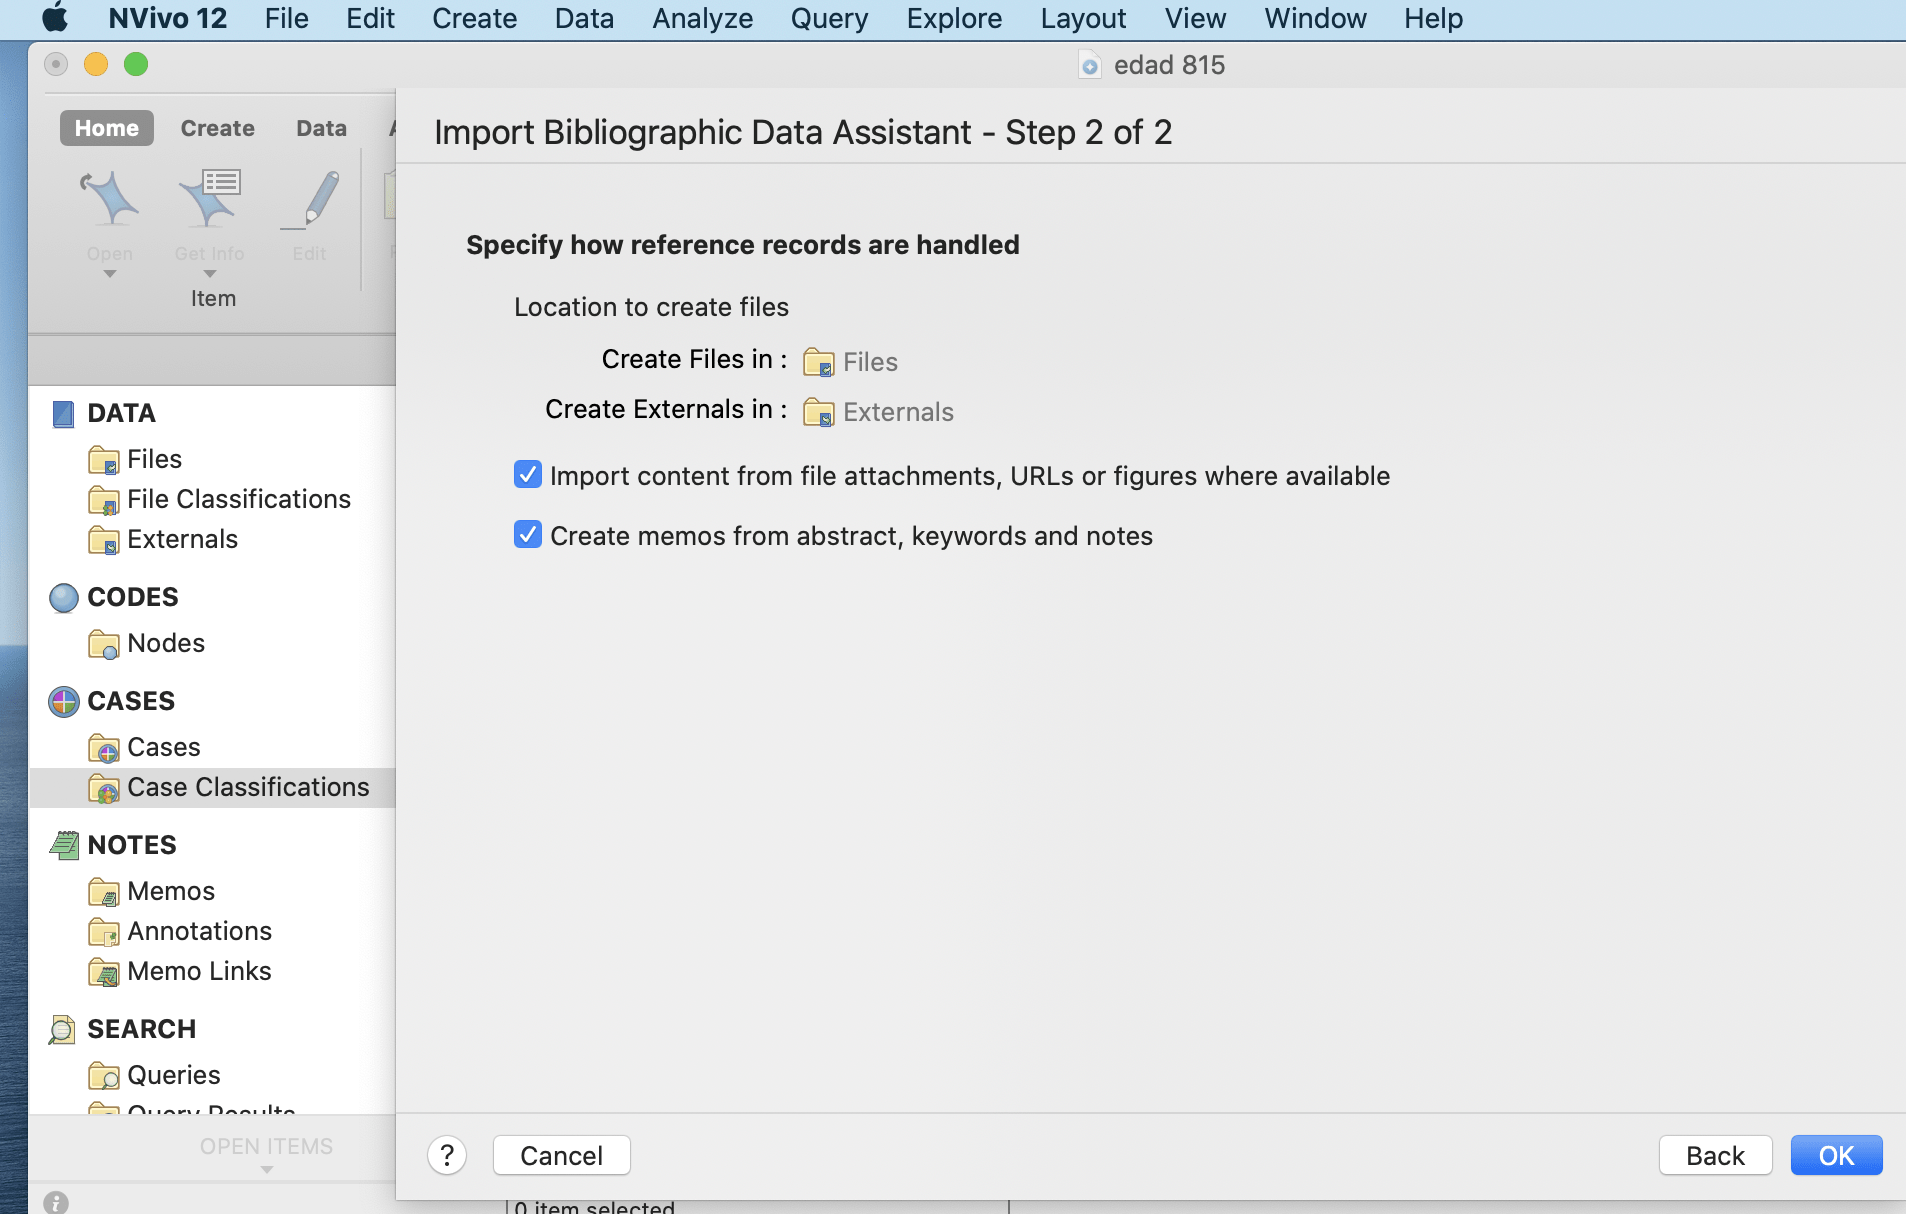
Bibliographic Data is imported using Mendeley, Endnote and other such databases or applications that are supported with Nvivo. Bibliographical data here refers to material in the form of articles, journals or conference proceedings. Common factors among all of these data are the author’s name and year of publication. Therefore, Nvivo helps to import and arrange these data with their titles as author’s name and year of publication. The process of importing bibliographical data is presented in the figures below.

select the appropriate data from external folder

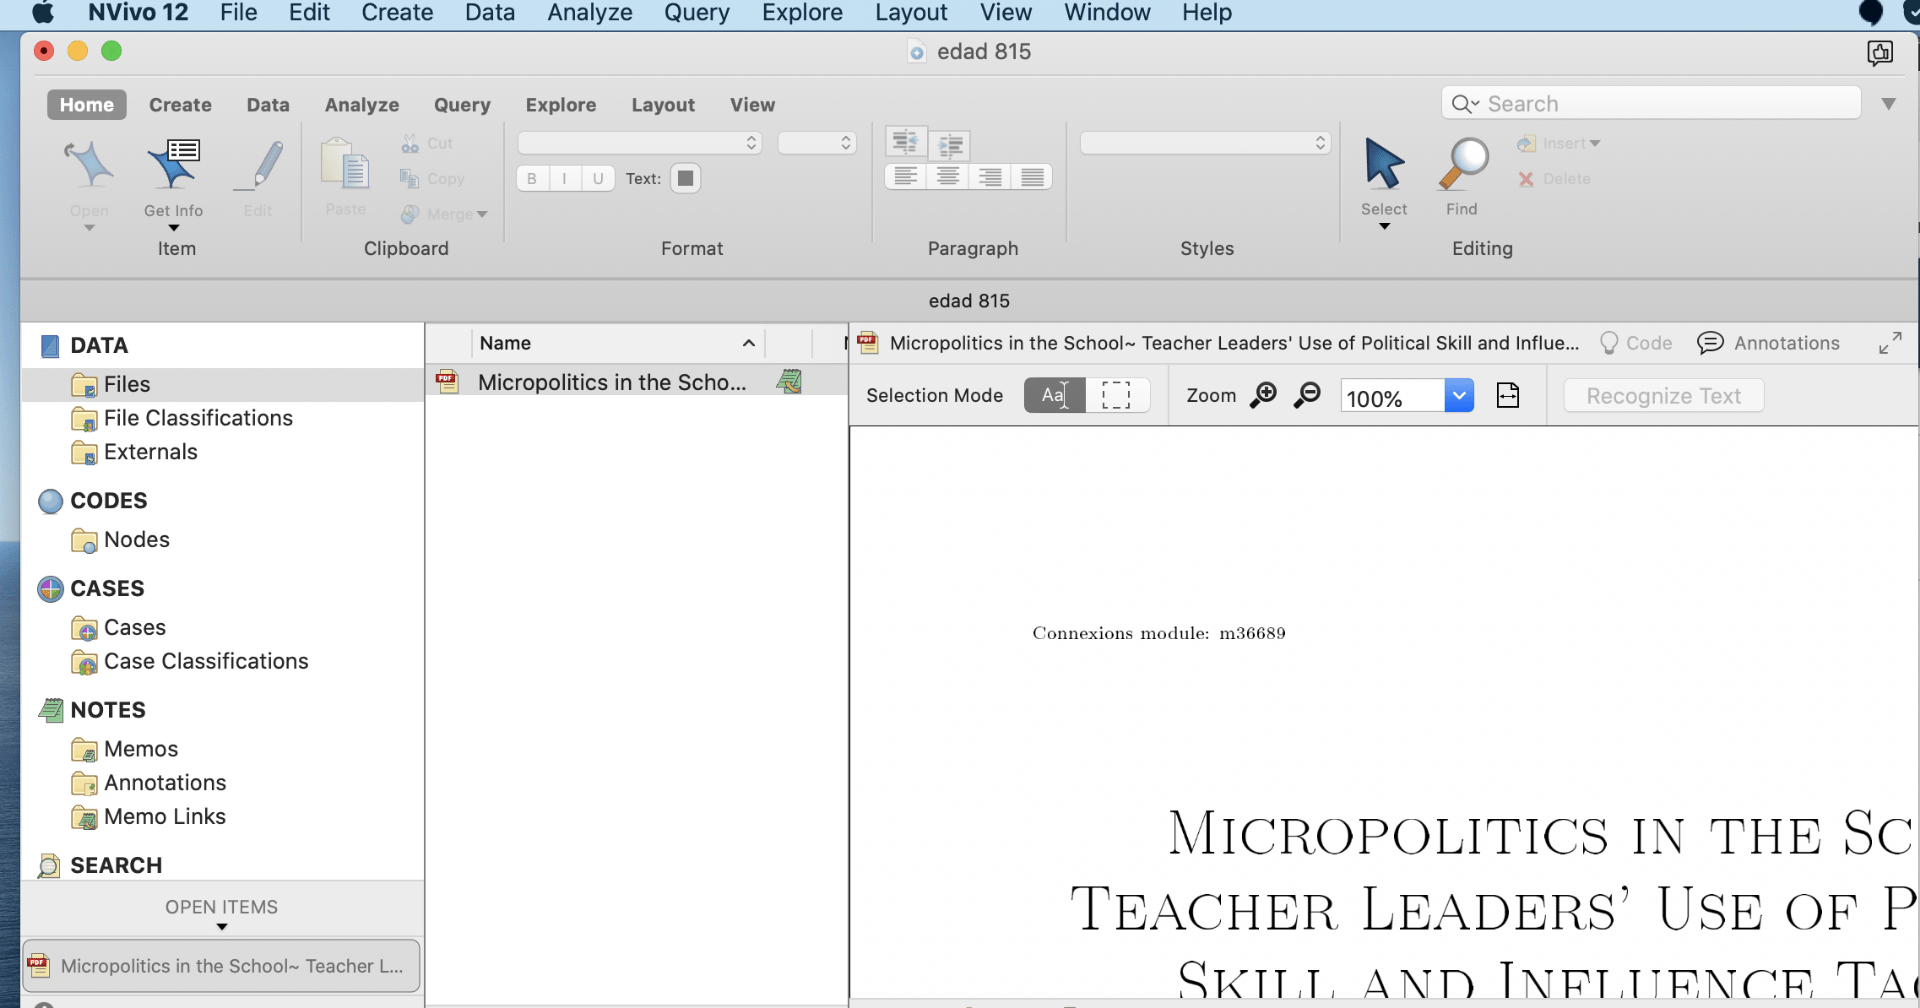
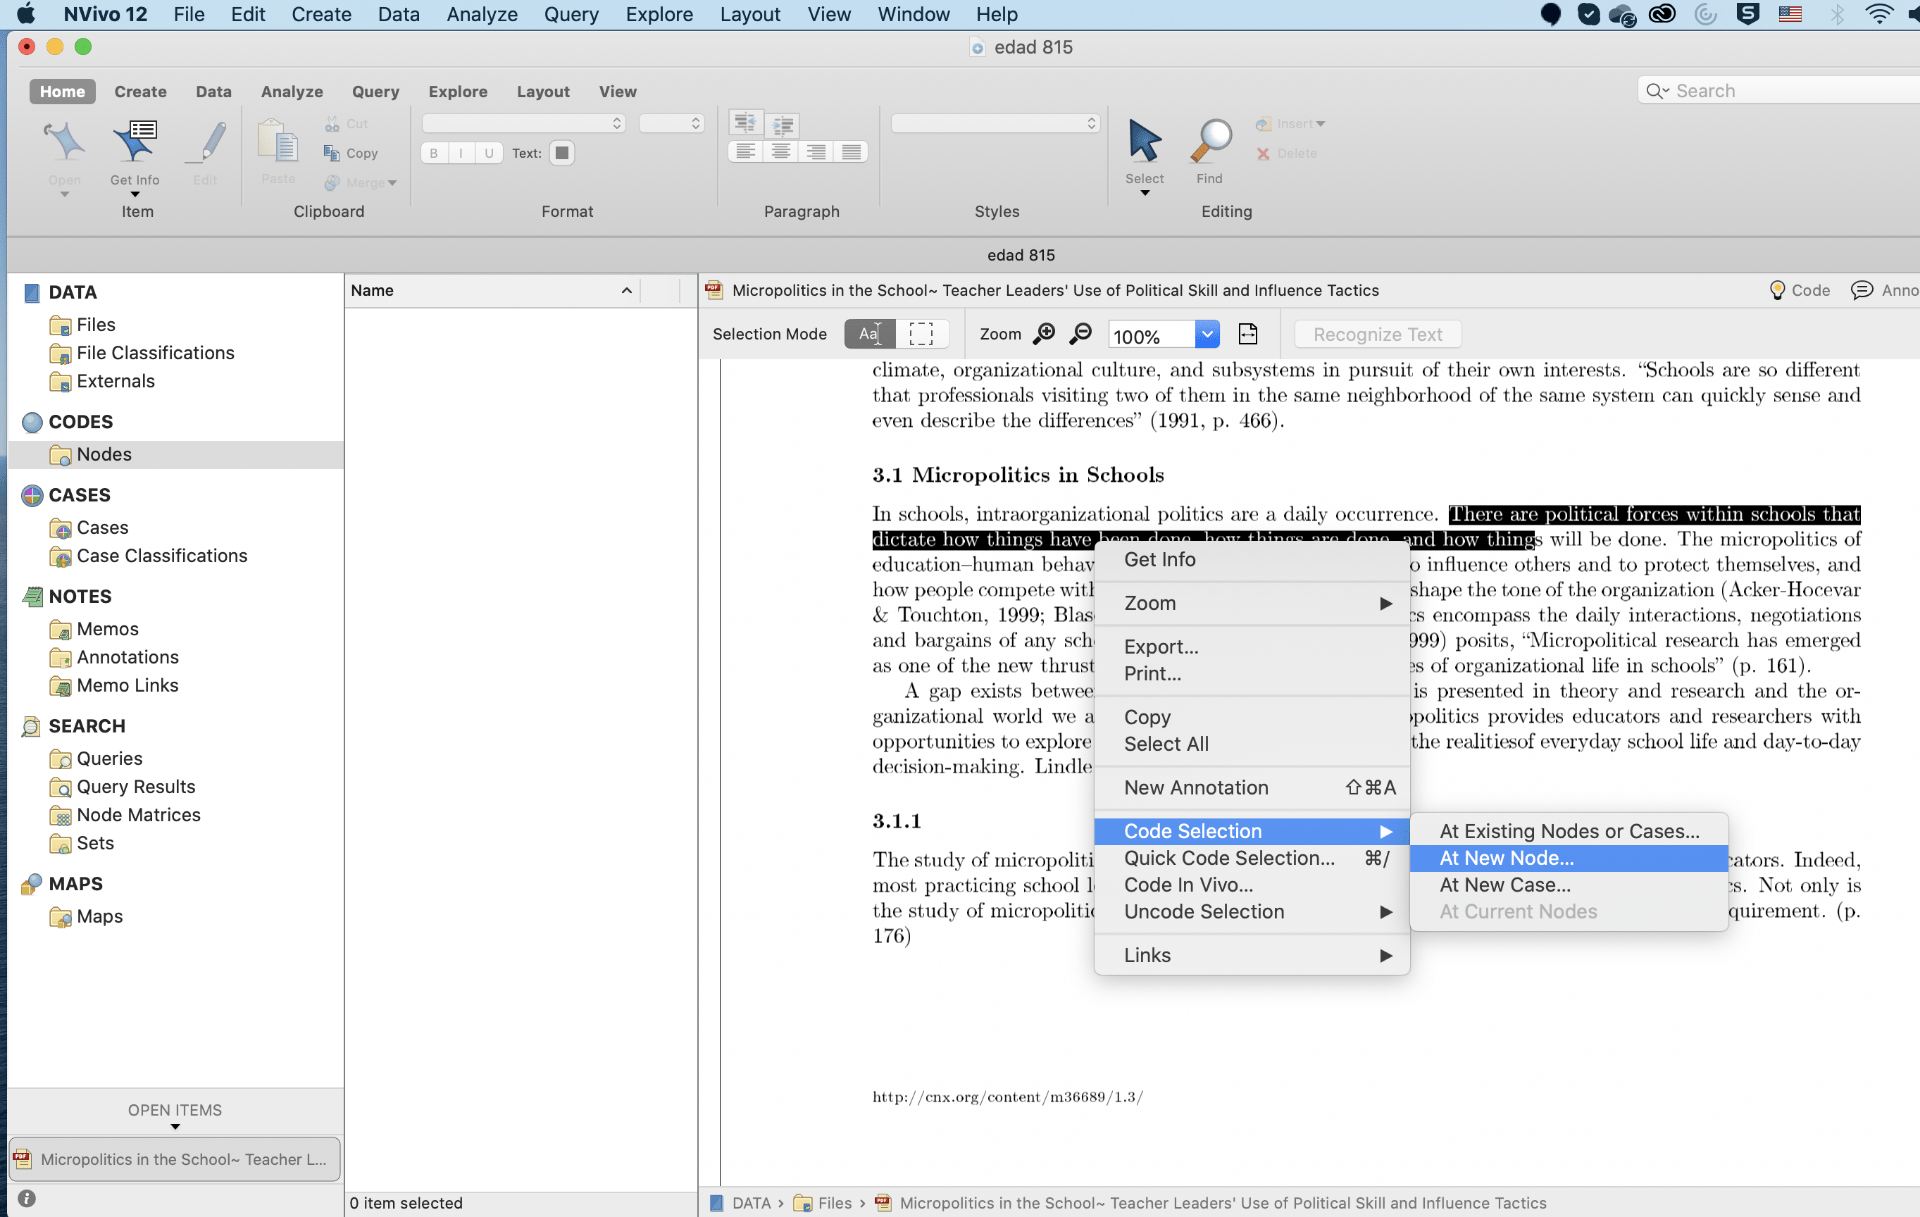
Coding is a process of identifying important parts or patterns in the sources and organizing them in theme node. Sources in case of literature review include material in the form of PDF. That means literature review in Nvivo requires grouping of information from PDF files in the forms of theme nodes. Nodes directly do not create content for literature review, they present ideas simply to help in framing a literature review. Nodes can be created on the basis of theme of the study, results of the study, major findings of the study or any other important information of the study. After creating nodes, code the information of each of the articles into its respective codes.
Nvivo allows coding the articles for preparing a literature review. Articles have tremendous amount of text and information in the forms of graphs, more importantly, articles are in the format of PDF. Since Nvivo does not allow editing PDF files, apply manual coding in case of literature review. There are two strategies of coding articles in Nvivo.
The Case Nodes of articles are created as per the author name or year of the publication.
For example: Create a case node with the name of that author and attach all articles in case of multiple articles of same Author in a row with different information. For instance in figure below, five articles of same author’s name, i.e., Mr. Toppings have been selected together to group in a case Node. Prepare case nodes like this then effortlessly search information based on different author’s opinion for writing empirical review in the literature.
Apart from the coding on themes, evidences, authors or opinions in different articles, run different queries based on the aim of the study. Nvivo contains different types of search tools that helps to find information in and across different articles. With the purpose of literature review, this article presents a brief overview of word frequency search, text search, and coding query in Nvivo.
Word frequency in Nvivo allows searching for different words in the articles. In case of literature review, use word frequency to search for a word. This will help to find what different author has stated about the word in the article. Run word frequency on all types of sources and limit the number of words which are not useful to write the literature.
For example, run the command of word frequency with the limit of 100 most frequent words . This will help in assessing if any of these words remotely provide any new information for the literature (figure below).

and
and

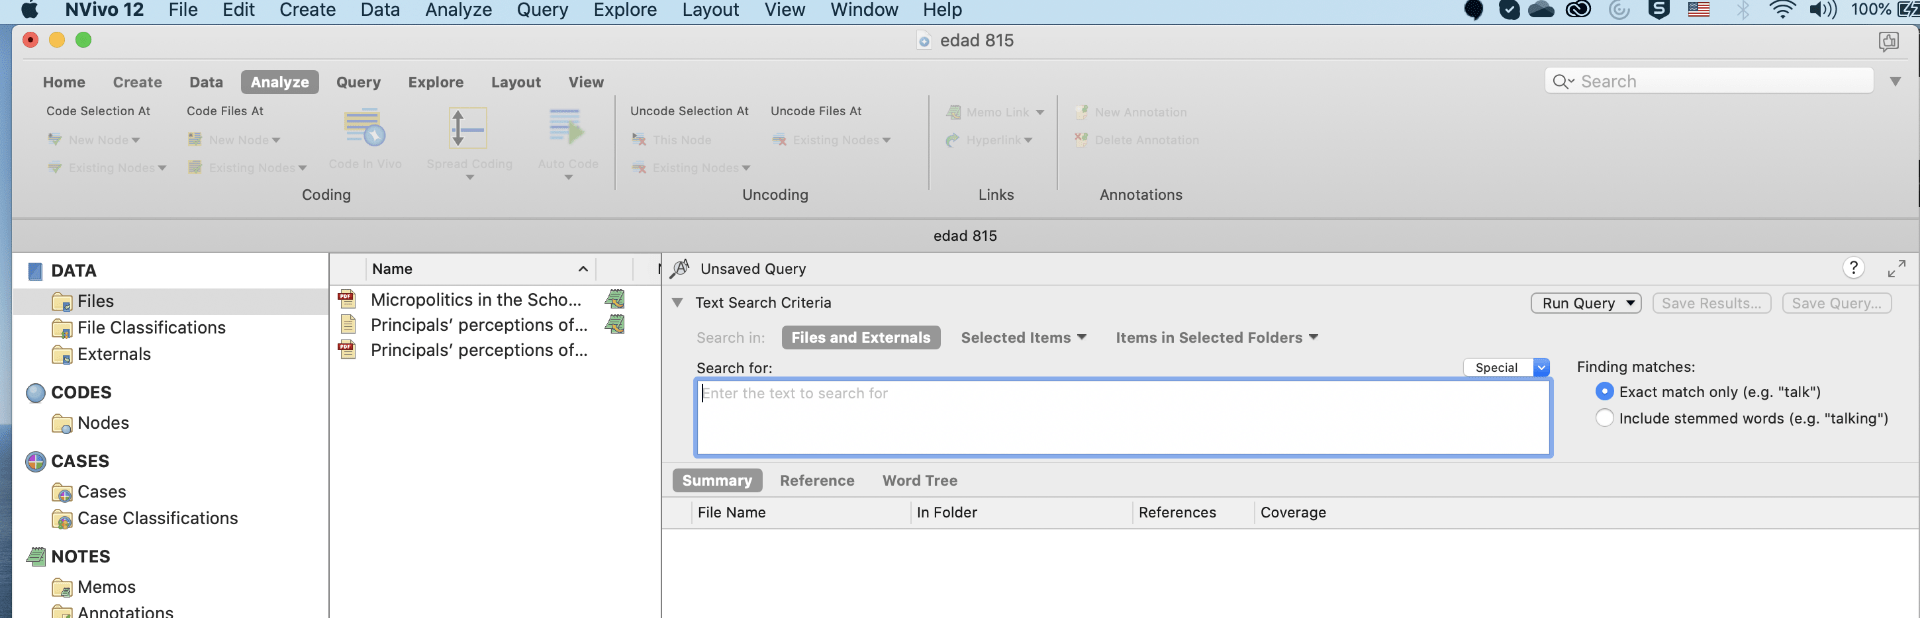
Text search is more elaborative tool then word frequency search in Nvivo. It allows Nvivo to search for a particular phrase or expression in the articles. Also, Nvivo gives the opportunity to make a node out of text search if a particular word, phrase or expression is found useful for literature.
For example: conduct a text search query to find a word “Scaffolding” in the articles. In this case Nvivo will provide all the words, phrases and expression slightly related to this word across all the articles (Figure 8 & 9). The difference between test search and word frequency lies in generating texts, sentences and phrases in the latter related to the queried word.
Apart from text search and word frequency search Nvivo also provides the option of coding query. Coding query helps in literature review to know the intersection between two Nodes. As mentioned previously, nodes contains the information from the articles. Furthermore it is also possible that two nodes contain similar set of information. Therefore, coding query helps to condense this information in the form of two way table which represents the intersection between selected nodes.
For example, in below figure, researcher have search the intersection between three nodes namely, academics, psychological and social on the basis of three attributes namely qantitative, qualitative and mixed research. This coding theory is performed to know which of the selected themes nodes have all types of attributes. Like, Coding Matrix in figure below shows that academic have all three types of attributes that is research (quantitative, qualitative and mixed). Where psychological has only two types of attributes research (quantitative and mixed).
In this way, Coding query helps researchers to generate intersection between two or more theme nodes. This also simplifies the pattern of qualitative data to write literature.
+++++++++++++++++++
Please do not hesitate to contact me with questions, suggestions before, during or after our workshop and about ANY questions and suggestions you may have about your Chapter 2 and, particularly about your literature review:
Plamen Miltenoff, Ph.D., MLIS
Professor | 320-308-3072 | pmiltenoff@stcloudstate.edu | http://web.stcloudstate.edu/pmiltenoff/faculty/ | schedule a meeting: https://doodle.com/digitalliteracy | Zoom, Google Hangouts, Skype, FaceTalk, Whatsapp, WeChat, Facebook Messenger are only some of the platforms I can desktopshare with you; if you have your preferable platform, I can meet you also at your preference.
++++++++++++++
more on nVIvo in this IMS blog
https://blog.stcloudstate.edu/ims?s=nvivo
more on Zotero in this IMS blog
https://blog.stcloudstate.edu/ims?s=zotero
Qualitative Content Analysis
analyse narratives from Kohler Riessman (1993), and a Qualitative Content Analysis with advice from Graneheim & Lundman, 2003)
storytelling
worked inductively by building patterns and categories from the bottom up by organizing the data into more abstract information units
Brief Introduction, Definition, Pros & Cons, Conclusion
https://towardsdatascience.com/data-democratization-918416c0f0e0
+++++++++++++
more on data analysis in this IMS blog
https://blog.stcloudstate.edu/ims?s=data+analysis
South Korea is using the analysis, information and references provided by this integrated data — all different real-time responses and information produced by the platform are promptly conveyed to people with different AI-based applications.
Whenever someone is tested positive for COVID-19, all the people in the vicinity are provided with the infected person’s travel details, activities, and commute maps for the previous two weeks through mobile notifications sent as a push system.
September 6, 2018 Bernard Marr
https://www.linkedin.com/pulse/what-data-lake-super-simple-explanation-anyone-bernard-marr/
James Dixon, the CTO of Pentaho is credited with naming the concept of a data lake. He uses the following analogy:
“If you think of a datamart as a store of bottled water – cleansed and packaged and structured for easy consumption – the data lake is a large body of water in a more natural state. The contents of the data lake stream in from a source to fill the lake, and various users of the lake can come to examine, dive in, or take samples.”
A data lake holds data in an unstructured way and there is no hierarchy or organization among the individual pieces of data. It holds data in its rawest form—it’s not processed or analyzed. Additionally, a data lakes accepts and retains all data from all data sources, supports all data types and schemas (the way the data is stored in a database) are applied only when the data is ready to be used.
What is a data warehouse?
A data warehouse stores data in an organized manner with everything archived and ordered in a defined way. When a data warehouse is developed, a significant amount of effort occurs during the initial stages to analyze data sources and understand business processes.
Data
Data lakes retain all data—structured, semi-structured and unstructured/raw data. It’s possible that some of the data in a data lake will never be used. Data lakes keep all data as well. A data warehouse only includes data that is processed (structured) and only the data that is necessary to use for reporting or to answer specific business questions.
Agility
Since a data lake lacks structure, it’s relatively easy to make changes to models and queries.
Users
Data scientists are typically the ones who access the data in data lakes because they have the skill-set to do deep analysis.
Security
Since data warehouses are more mature than data lakes, the security for data warehouses is also more mature.
+++++++++++++++
more on big data in this IMS blog
https://blog.stcloudstate.edu/ims?s=big+data
++++++++++++
more on data analytics in education in this IMS blog
https://blog.stcloudstate.edu/ims?s=data+analytics
++++++++++++++++
more on big data in education in this IMS blog
https://blog.stcloudstate.edu/ims?s=big+data
Qualitative
Document Analysis
Document analysis is a form of qualitative research in which documents are interpreted by the researcher to give voice and meaning around an assessment topic. Analyzing documents incorporates coding content into themes similar to how focus group or interview transcripts are analyzed. A rubric can also be used to grade or score a document. There are three primary types of documents:
• Public Records: The official, ongoing records of an organization’s activities. Examples include student transcripts, mission statements, annual reports, policy manuals, student handbooks, strategic plans, and syllabi.
• Personal Documents: First-person accounts of an individual’s actions, experiences, and beliefs. Examples include calendars, e-mails, scrapbooks, blogs, Facebook posts, duty logs, incident reports, reflections/journals, and newspapers.
• Physical Evidence: Physical objects found within the study setting (often called artifacts). Examples include flyers, posters, agendas, handbooks, and training materials.
How do I analyse “Document analysis”
http://www.methodspace.com/forums/topic/how-do-i-analyse-document-analysis/
As with all research, how you collect and analyse the data should depend on what you want to find out. Since you haven’t told us that, it is difficult to give you any precise advice. However, one really important matter in using documents as sources, whatever the overall aim of your research, is that data from documents are very different from data from speech events such as interviews, or overheard conversations.So the first analytic question you need to ask with regard to documents is ‘how are these data shaped by documentary production ?’ Something which differentiates nearly all data from documents from speech data is that those who compose documents know what comes at the end while still able to alter the beginning; which gives far more opportunity for consideration of how the recepient of the utterances will view the provider; ie for more artful self-presentation. Apart from this however, analysing the way documentary practice shapes your data will depend on what these documents are: for example your question might turn out to be ‘How are news stories produced ?’ – if you are using news reports, or ‘What does this bureaucracy consider relevant information (and what not relevant and what unmentionable) ? if you are using completed proformas or internal reports from some organisation.
An analysis technique is just like a hardware tool. It depends where and with what you are working to choose the right one. For a nail you should use a hammer, and there are lots of types of hammers to choose, depending on the type of nail.
So, in order to tell you the bettet technique, it is important to know the objectives you intend to reach and the theoretical framework you are using. Perhaps, after that, We could tell you if you should use content analysis, discourse or grounded theory (which type of it as, like the hammer, there are several types of GTs).
RESEARCH METHODOLOGY IN EDUCATION
AN INTRODUCTION TO DOCUMENT ANALYSIS
written after Bowen (2009), but well chewed and digested.
The Use of Qualitative Content Analysis in Case Study Research
Florian Kohlbacher http://www.qualitative-research.net/index.php/fqs/article/view/75/153
1. Introduction: Qualitative vs. Quantitative Research?
excellent guide to the structure of a qualitative research
++++++++++++++++
more on qualitative research in this IMS blog
https://blog.stcloudstate.edu/ims?s=qualitative+research
https://www.linkedin.com/groups/934617/934617-6255144273688215555
SUBMIT A 1-2 PAGE CHAPTER PROPOSAL
Deadline – June 1, 2017
Title: Responsible Analytics and Data Mining in Education: Global Perspectives on Quality, Support, and Decision-Making
Synopsis:
Due to rapid advancements in our ability to collect, process, and analyze massive amounts of data, it is now possible for educators at all levels to gain new insights into how people learn. According to Bainbridge, et. al. (2015), using simple learning analytics models, educators now have the tools to identify, with up to 80% accuracy, which students are at the greatest risk of failure before classes even begin. As we consider the enormous potential of data analytics and data mining in education, we must also recognize a myriad of emerging issues and potential consequences—intentional and unintentional—to implement them responsibly. For example:
· Who collects and controls the data?
· Is it accessible to all stakeholders?
· How are the data being used, and is there a possibility for abuse?
· How do we assess data quality?
· Who determines which data to trust and use?
· What happens when the data analysis yields flawed results?
· How do we ensure due process when data-driven errors are uncovered?
· What policies are in place to address errors?
· Is there a plan for handling data breaches?
This book, published by Routledge Taylor & Francis Group, will provide insights and support for policy makers, administrators, faculty, and IT personnel on issues pertaining the responsible use data analytics and data mining in education.
Important Dates:
· June 1, 2017 – Chapter proposal submission deadline
· July 15, 2017 – Proposal decision notification
· October 15, 2017 – Full chapter submission deadline
· December 1, 2017 – Full chapter decision notification
· January 15, 2018 – Full chapter revisions due
++++++++++++++++++
more on data mining in this IMS blog
https://blog.stcloudstate.edu/ims?s=data+mining
more on analytics in this IMS blog
https://blog.stcloudstate.edu/ims?s=analytics