new report from market research firm Gartner, overall device shipments will remain flat in 2017, even as traditional PCs (including laptops) go into a decline that’s forecast to last at least through 2019. Excluding smart phones
Introduction (5-10 min)
Plamen: http://web.stcloudstate.edu/pmiltenoff/faculty/
students: interests and related information
Group assignment (5-10 min)
Effective communication strategies. List 3-5 and discuss the pros and cons (what makes them effective and are there any impediments, limitations)
Class discussion on effective communication strategies: based on the group work findings, how do you think digital storytelling may be [can it be] an effective communication tool
What is Storytelling? How does it differ from Digital Storytelling?
Rossiter & Garcia (2010) consider “digital stories are short vignettes that combine the art of telling stories with multimedia objects including images, audio, and video” (p. 37)
Is Digital Storytelling more then just storytelling on technology steroids?
What is Digital Storytelling (DS) for school leadership? A bibliographic research reveals a plenitude of research on DS in the classroom, for educators, but not much for educational leaders.
Guajardo, Oliver, Rodrigez, Valcez, Cantu, & Guajardo (2011) view digital storytelling for emerging educational leaders as “as a process for data creation, analysis, and synthesis.”
There is information for corporate leaders or community leaders and DS, but not much for ed leaders.
Let’s create our own understanding of digital storytelling for educational leaders.
Basic definitions, concepts and processes.
Learn about Web 1.0 versus Web 2.0; the Cloud; transliteracy and multiliteracy
Multimodal Literacy refers to meaning-making that occurs through the reading, viewing, understanding, responding to and producing and interacting with multimedia and digital texts. It may include oral and gestural modes of talking, listening and dramatising as well as writing, designing and producing such texts. The processing of modes, such as image, words, sound and movement within texts can occur simultaneously and is often cohesive and synchronous. Sometimes specific modes may dominate.
group work (15-20) min
split in groups of 3: an ed leader, a media specialist (or teacher with technology background) and a teacher (to represent a school committee on community relations)
you have 5 min to research (Internet, access to school resources) and 5-10 min to come up with a strategy for use of digital storytelling for expanding and improving community relationship
Base your strategy on existing examples.
E.g.:
Do the following electronic resources regarding this particular educational institution relay digital story: http://strideacademy.org/ https://www.facebook.com/StrideAcademy/ https://twitter.com/search?q=Stride%20Academy%20Charter%20School&src=tyah https://youtu.be/eekIUqMQ4v0
What do you like?
What would you do differently?
Digital Storytelling for building, expanding, improving community relations – final thoughts
**********************
literature:
Rossiter, M., & Garcia, P. A. (2010). Digital storytelling: A new player on the narrative field.
New Directions For Adult & Continuing Education, 2010(126), 37-48. http://login.libproxy.stcloudstate.edu/login?qurl=http%3a%2f%2fsearch.ebscohost.
com%2flogin.aspx%3fdirect%3dtrue%26db%3daph%26AN%3d51532202%26
site%3dehost-live%26scope%3dsite
A Strategist’s Guide to Industry 4.0. Global businesses are about to integrate their operations into a seamless digital whole, and thereby change the world.
Industrial revolutions are momentous events. By most reckonings, there have been only three. The first was triggered in the 1700s by the commercial steam engine and the mechanical loom. The harnessing of electricity and mass production sparked the second, around the start of the 20th century. The computer set the third in motion after World War II.
Henning Kagermann, the head of the German National Academy of Science and Engineering (Acatech), did exactly that in 2011, when he used the term Industrie 4.0 to describe a proposed government-sponsored industrial initiative.
The term Industry 4.0 refers to the combination of several major innovations in digital technology
These technologies include advanced robotics and artificial intelligence; sophisticated sensors; cloud computing; the Internet of Things; data capture and analytics; digital fabrication (including 3D printing); software-as-a-service and other new marketing models; smartphones and other mobile devices; platforms that use algorithms to direct motor vehicles (including navigation tools, ride-sharing apps, delivery and ride services, and autonomous vehicles); and the embedding of all these elements in an interoperable global value chain, shared by many companies from many countries.
Companies that embrace Industry 4.0 are beginning to track everything they produce from cradle to grave, sending out upgrades for complex products after they are sold (in the same way that software has come to be updated). These companies are learning mass customization: the ability to make products in batches of one as inexpensively as they could make a mass-produced product in the 20th century, while fully tailoring the product to the specifications of the purchaser
.
Three aspects of digitization form the heart of an Industry 4.0 approach.
• The full digitization of a company’s operations
• The redesign of products and services
• Closer interaction with customers
Making Industry 4.0 work requires major shifts in organizational practices and structures. These shifts include new forms of IT architecture and data management, new approaches to regulatory and tax compliance, new organizational structures, and — most importantly — a new digitally oriented culture, which must embrace data analytics as a core enterprise capability.
Klaus Schwab put it in his recent book The Fourth Industrial Revolution (World Economic Forum, 2016), “Contrary to the previous industrial revolutions, this one is evolving at an exponential rather than linear pace.… It is not only changing the ‘what’ and the ‘how’ of doing things, but also ‘who’ we are.”
This great integrating force is gaining strength at a time of political fragmentation — when many governments are considering making international trade more difficult. It may indeed become harder to move people and products across some national borders. But Industry 4.0 could overcome those barriers by enabling companies to transfer just their intellectual property, including their software, while letting each nation maintain its own manufacturing networks.
+++++++++++++++++++++++++++
more on the Internet of Things in this IMS blog https://blog.stcloudstate.edu/ims?s=internet+of+things
Because the questionnaire data comprised both Likert scales and open questions, they were analyzed quantitatively and qualitatively. Textual data (open responses) were qualitatively analyzed by coding: each segment (e.g. a group of words) was assigned to a semantic reference category, as systematically and rigorously as possible. For example, “Using an iPad in class really motivates me to learn” was assigned to the category “positive impact on motivation.” The qualitative analysis was performed using an adapted version of the approaches developed by L’Écuyer (1990) and Huberman and Miles (1991, 1994). Thus, we adopted a content analysis approach using QDAMiner software, which is widely used in qualitative research (see Fielding, 2012; Karsenti, Komis, Depover, & Collin, 2011). For the quantitative analysis, we used SPSS 22.0 software to conduct descriptive and inferential statistics. We also conducted inferential statistics to further explore the iPad’s role in teaching and learning, along with its motivational effect. The results will be presented in a subsequent report (Fievez, & Karsenti, 2013)
The 20th century notion of conducting a qualitative research by an oral interview and then processing manually your results had triggered in the second half of the 20th century [sometimes] condescending attitudes by researchers from the exact sciences.
The reason was the advent of computing power in the second half of the 20th century, which allowed exact sciences to claim “scientific” and “data-based” results.
One of the statistical package, SPSS, is today widely known and considered a magnificent tools to bring solid statistically-based argumentation, which further perpetuates the superiority of quantitative over qualitative method.
At the same time, qualitative researchers continue to lag behind, mostly due to the inertia of their approach to qualitative analysis. Qualitative analysis continues to be processed in the olden ways. While there is nothing wrong with the “olden” ways, harnessing computational power can streamline the “olden ways” process and even present options, which the “human eye” sometimes misses.
Below are some suggestions, you may consider, when you embark on the path of qualitative research.
excellent guide to the structure of a qualitative research
Palys, T., & Atchison, C. (2012). Qualitative Research in the Digital Era: Obstacles and Opportunities. International Journal Of Qualitative Methods, 11(4), 352-367.
Palys and Atchison (2012) present a compelling case to bring your qualitative research to the level of the quantitative research by using modern tools for qualitative analysis.
1. The authors correctly promote NVivo as the “jaguar’ of the qualitative research method tools. Be aware, however, about the existence of other “Geo Metro” tools, which, for your research, might achieve the same result (see bottom of this blog entry).
2. The authors promote a new type of approach to Chapter 2 doctoral dissertation and namely OCR-ing PDF articles (most of your literature as of 2017 is mostly either in PDF or electronic textual format) through applications such as
Abbyy Fine Reader, https://www.abbyy.com/en-us/finereader/
OmniPage, http://www.nuance.com/for-individuals/by-product/omnipage/index.htm
Readirus http://www.irislink.com/EN-US/c1462/Readiris-16-for-Windows—OCR-Software.aspx
The text from the articles is processed either through NVIVO or related programs (see bottom of this blog entry). As the authors propose: ” This is immediately useful for literature review and proposal writing, and continues through the research design, data gathering, and analysis stages— where NVivo’s flexibility for many different sources of data (including audio, video, graphic, and text) are well known—of writing for publication” (p. 353).
In other words, you can try to wrap your head around huge amount of textual information, but you can also approach the task by a parallel process of processing the same text with a tool.
+++++++++++++++++++++++++++++
Here are some suggestions for Computer Assisted / Aided Qualitative Data Analysis Software (CAQDAS)for a small and a large community applications):
text mining: https://en.wikipedia.org/wiki/Text_mining Text mining, also referred to as text data mining, roughly equivalent to text analytics, is the process of deriving high-quality information from text. High-quality information is typically derived through the devising of patterns and trends through means such as statistical pattern learning. Text mining usually involves the process of structuring the input text (usually parsing, along with the addition of some derived linguistic features and the removal of others, and subsequent insertion into a database), deriving patterns within the structured data, and finally evaluation and interpretation of the output. https://ischool.syr.edu/infospace/2013/04/23/what-is-text-mining/
Qualitative data is descriptive data that cannot be measured in numbers and often includes qualities of appearance like color, texture, and textual description. Quantitative data is numerical, structured data that can be measured. However, there is often slippage between qualitative and quantitative categories. For example, a photograph might traditionally be considered “qualitative data” but when you break it down to the level of pixels, which can be measured.
word of caution, text mining doesn’t generate new facts and is not an end, in and of itself. The process is most useful when the data it generates can be further analyzed by a domain expert, who can bring additional knowledge for a more complete picture. Still, text mining creates new relationships and hypotheses for experts to explore further.
Pros and Cons of Computer Assisted Qualitative Data Analysis Software
+++++++++++++++++++++++++
more on quantitative research:
Asamoah, D. A., Sharda, R., Hassan Zadeh, A., & Kalgotra, P. (2017). Preparing a Data Scientist: A Pedagogic Experience in Designing a Big Data Analytics Course. Decision Sciences Journal of Innovative Education, 15(2), 161–190. https://doi.org/10.1111/dsji.12125
++++++++++++++++++++++++
literature on quantitative research:
St. Cloud State University MC Main Collection – 2nd floor
AZ195 .B66 2015
p. 161 Data scholarship in the Humanities
p. 166 When Are Data?
Philip Chen, C. L., & Zhang, C.-Y. (2014). Data-intensive applications, challenges, techniques and technologies: A survey on Big Data. Information Sciences, 275(Supplement C), 314–347. https://doi.org/10.1016/j.ins.2014.01.015
Do you know any fact checking sites? Can you identify spot sponsored content? Do you understand syndication? What do you understand under “media literacy,” “news literacy,” “information literacy.” https://blog.stcloudstate.edu/ims/2017/03/28/fake-news-resources/
what is social media (examples). why is called SM? why is so popular? what makes it so popular?
use SM tools for your research and education:
– Determining your topic. How to?
Digg http://digg.com/, Reddit https://www.reddit.com/ , Quora https://www.quora.com
Facebook, Twitter – hashtags (class assignment 2-3 min to search)
LinkedIn Groups
YouTube and Slideshare (class assignment 2-3 min to search)
Flickr, Instagram, Pinterest for visual aids (like YouTube they are media repositories)
how data is produced, collected and analyzed. make accessible all kind of data and info
ask good q/s and find good answers, share finding in meaningful ways. this is where digital literacy overshadows information literacy and this the fact that SCSU library does not understand; besides teaching students how to find and evaluate data, I also teach them how to communicate effectively using electronic tools.
connecting people tools and resources and making it easier for everybody. building collaborative, open and interdisciplinary
robust data computational literates. developing workshops, project and events to practice new skills. to position the library as the interdisciplinary nexus
what are data: definition. items of information, facts, traces of content and form. higher level, conception discussion about data in terms of social effects: matadata capturing information about the world, social political and economic changes. move away the mystic conceptions about data. nothing objective about data.
the emergence of IoT – digital meets physical. cyber physical systems. smart objects driven by industry. . proliferation of sensor and device – smart devices.
what does privacy looks like ? what is netneutrality when IoT? library must restructure : collaborate across institutions about collections of data in opien and participatory ways. put IoT in the hands of make and break things (she is maker space aficionado)
make and break things hackathons – use cheap devices such as Arduino and Pi.
data literacy programs with higher level conception exploration; libraries empower the campus in data collection. data science norms, store and share data to existing repositories and even catalogs. commercial services to store and connect data, but very restrictive and this is why libraries must be involved.
linked data and dark data
linked data – draw connections around online data most of the data are locked. linked data uses metadata to link related information in ways computers can understand.
libraries take advantage of link data. link data opportunity for semantics, natural language processing etc. if hidden data is relative to our communities, it is a library responsibility to provide it. community data practitioners
dark data
massive data, which cannot be analyzed by relational processing. data not yield significant findings. might be valuable for researchers: one persons trash is another persons’ treasure. preserving data and providing access to info. collaborate with researchers across disciplines and assist decide what is worth keeping and what discarding and how to study.
rich learning experience working with lined and dark data enable fresh perspective and learning how to work with data architecture. data literacy programming.
in context of data is different from open source and open projects. the social side of data science . advising researchers on navigation data, ethical compilations.
open science movement .https://cos.io/ pushing beyond licences and reframe, position ourselves as collaborators
analysis and publishing ; use tools that can be shared and include data, code and executable files.
reproducibility and contestability https://www.lib.ncsu.edu/events/series/summer-of-open-science
In the age of Big Data, there is an abundance of free or cheap data sources available to libraries about their users’ behavior across the many components that make up their web presence. Data from vendors, data from Google Analytics or other third-party tracking software, and data from user testing are all things libraries have access to at little or no cost. However, just like many students can become overloaded when they do not know how to navigate the many information sources available to them, many libraries can become overloaded by the continuous stream of data pouring in from these sources. This session will aim to help librarians understand 1) what sorts of data their library already has (or easily could have) access to about how their users use their various web tools, 2) what that data can and cannot tell them, and 3) how to use the datasets they are collecting in a holistic manner to help them make design decisions. The presentation will feature examples from the presenters’ own experience of incorporating user data in decisions related to design the Bethel University Libraries’ web presence.
silos, IT barrier, focusing on student success, retention, server space is cheap, if
promotion and tenure for faculty can include incentive to work with the librarian
lack of fear, changing the mindset.
deep collaboration both within and cross-consortia
don’t rely on vendor solutions. changing mindset
development = oppty (versus development as “work”)
private higher education is PALNI
3d virtual picture of disastrous areas. unlock the digital information to be digitally accessible to all people who might be interested.
they opened the maps of Katmandu for the local community and they were coming up with the strategies to recover. democracy in action
i can’t stop thinking that the keynote speaker efforts are mere follow up of what Naomi Klein explains in her Shock Doctrine: http://www.naomiklein.org/shock-doctrine: a government country seeks reasons to destroy another country or area and then NGOs from the same country go to remedy the disasters
A question from a librarian from the U about the use of drones. My note: why did the SCSU library have to give up its drone?
Douglas County Library model. too resource intensive to continue
Marmot Library Network
ILS integrated library system – shared with other counties, same sever for the entire consortium. they have a programmer, viewfind, open source, discovery player, he customized viewfind community to viewfind plus. instead of using the ILS public access catalogue, they are using the Vufind interface
Caiifa Enki. public library – single access collection. they purchase ebooks from the publisher and they are using also the viewfind interface. but not integrated with the library catalogs. Kansas public library went from OverDrive to Viewfind. CA State library is funding for the time being this effort.
types of content – publisher will not understand issue, which clear for librarians
PDF and epub formats
purchase content –
title by title selection – academia is tired of selections. although it is intended to buy also collections
library – owned ( and shared collections)
host content from libraries – papers in academic lib, genealogy in pub lib.
options in license models .
e resource content. not only ebooks, after it is taken care of, add other types of digital objects.
instead of replicate, replacement of the commercial aggregators,
Amigos Shelf interface is the product of the presenter
instead of having a young reader collection as SCSU has on the third floor, an academic library is outsourcing through AMigos shelf ebooks for young readers
Harper Collins is too cumbersome and the reason to avoid working with them.
security issues. some of the material sent over ftp and immediately moved to sftp
decisions – use of internal resources only, if now – amazon
programmer used for the pilot. contracted programmers. lack of the ability to see the large picture. eventually hired a full time person, instead of outsourcing. RDA compliant MARC.
ONIX, spreadsheet MARC.
Decision about who to start with : public or academic.
attempt to keep pricing down –
own agreement with the customers, separate from the agreement with the Publisher
current development: web-based online reading, shared-consortial collections and SIP2 authentication
An article in The Conversation recently argued universities should ban PowerPoint because it makes students stupid and professors boring.
Originally for Macintosh, the company that designed it was bought by Microsoft. After its launch the software was increasingly targeted at business professionals, especially consultants and busy salespeople.
As it turns out, PowerPoint has not empowered academia. The basic problem is that a lecturer isn’t intended to be selling bullet point knowledge to students, rather they should be making the students encounter problems. Such a learning process is slow and arduous, and cannot be summed up neatly. PowerPoint produces stupidity, which is why some, such as American statistician Edward Tufte have said it is “evil”.
Of course, new presentation technologies like Prezi, SlideRocket or Impress add a lot of new features and 3D animation, yet I’d argue they only make things worse. A moot point doesn’t become relevant by moving in mysterious ways. The truth is that PowerPoints actually are hard to follow and if you miss one point you are often lost.
While successfully banning Facebook and other use of social media in our masters programme in philosophy and business at Copenhagen Business School, we have also recently banned teachers using PowerPoint. Here we are in sync with the US armed forces, where Brigadier-General Herbert McMaster banned it because it was regarded as a poor tool for decision-making.
Courses designed around slides therefore propagate the myth that students can become skilled and knowledgeable without working through dozens of books, hundreds of articles and thousands of problems.
A review of research on PowerPoint found that while students liked PowerPoint better than overhead transparencies, PowerPoint did not increase learning or grades
Research comparing teaching based on slides against other methods such as problem-based learning – where students develop knowledge and skills by confronting realistic, challenging problems – predominantly supports alternative methods.
PowerPoint slides are toxic to education for three main reasons:
students come to think of a course as a set of slides. Good teachers who present realistic complexity and ambiguity are criticised for being unclear. Teachers who eschew bullet points for graphical slides are criticised for not providing proper notes.
Slides discourage reasonable expectations
Measuring the wrong things
If slide shows are so bad, why are they so popular?
Exams, term papers and group projects ostensibly measure knowledge or ability. Learning is the change in knowledge and skills and therefore must be measured over time.
When we do attempt to measure learning, the results are not pretty. US researchers found that a third of American undergraduates demonstrated no significant improvement in learning over their four-year degree programs.
They tested students in the beginning, middle and end of their degrees using the Collegiate Learning Assessment, an instrument that tests skills any degree should improve – analytic reasoning, critical thinking, problem solving and writing.
The content itself isn’t VR, just the digital venue.
Along with these three apps, Google has also brought NextVR to Daydream, which is the only app of the bunch that actually offers 360-degree, 3D video. With Netflix VR, HBO VR, NextVR, Hulu VR and Google Play Movies & TV, Daydream has suddenly become the undisputed leader of VR video.
++++++++++++++++++
More on on VR in this IMS blog https://blog.stcloudstate.edu/ims?s=vr
Emanuel, J. (2013). Digital Native Librarians, Technology Skills, and Their Relationship with Technology. Information Technology & Libraries, 32(3), 20-33.
The article focuses on a study that examined the technology skills of millennial academic librarians and their attitudes toward technology. The results of a three-part survey indicated that the respondents were most comfortable with technologies that are used rather than those that enable people to create content. There was also a lack of understanding about relational databases among the respondents.
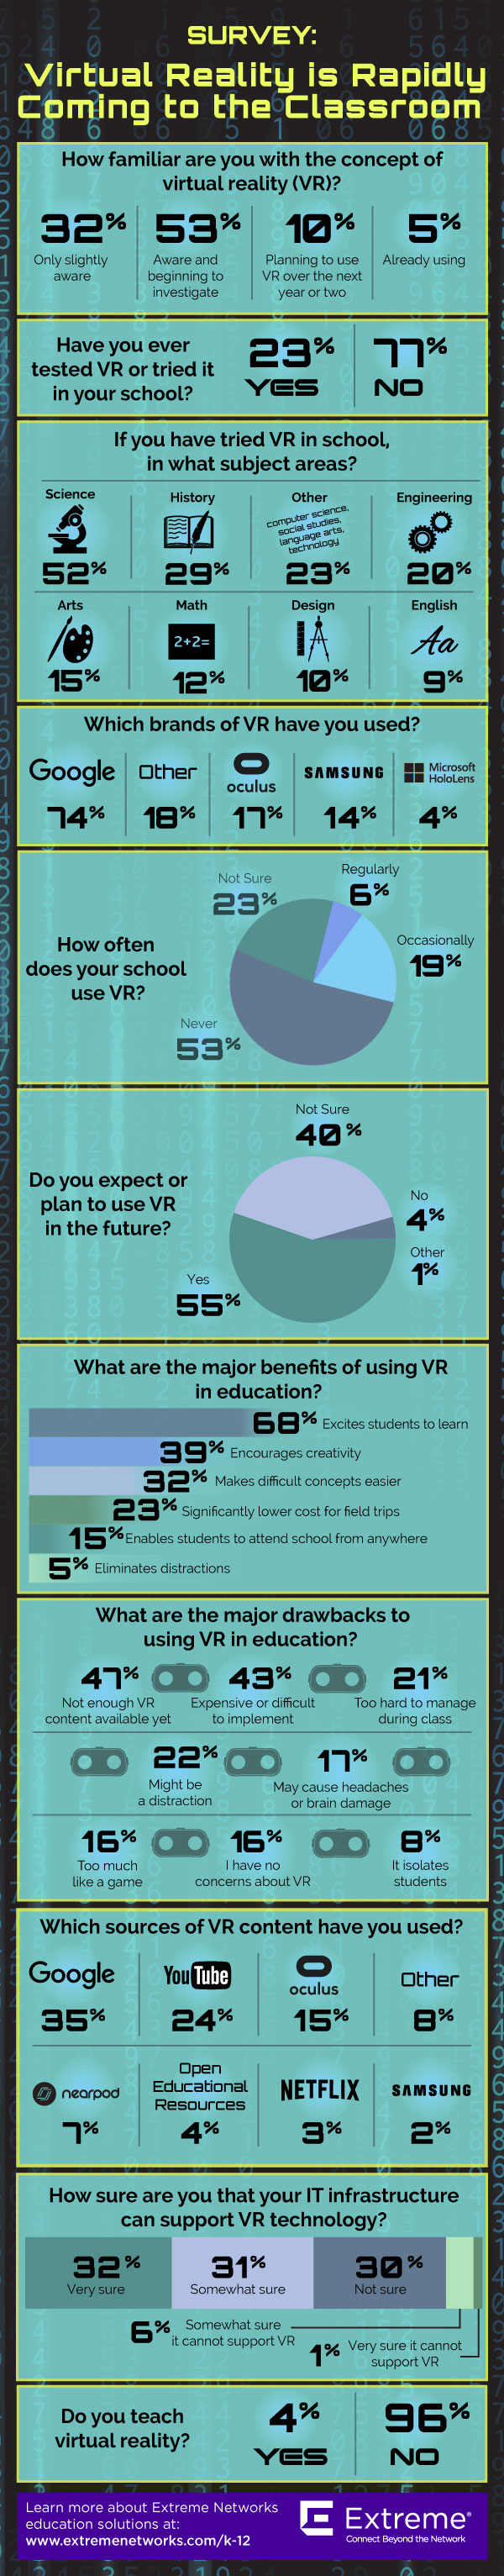
A new survey from Extreme Networks aimed to answer this question by polling nearly 350 schools within higher ed and K-12. According to the results, 23 percent of respondents have tested VR, while 77 percent have not (40 percent of schools polled still aren’t sure if they’ll use the technology in the future). Meaning that although virtual reality has an important and growing role in education, it may take several years to get all institutions on board.
The survey notes that one challenge to implementation is that nearly two-thirds of schools are “somewhat or not sure” their IT infrastructure can currently support VR technology.
Respondents also had concerns about the lack of VR content available, as well as a lack of student resources, with 43 percent of respondents saying that VR is too expensive or difficult to implement. However, one respondent is taking this approach to providing VR to students at low or no cost: “We are putting out a call for old smartphone donations in our [community for those] who no longer need them. With the donations, we’re making sets of Google Cardboard and phones to create traveling VR stations for classes in all of our buildings.”
1. For new research: According to the Wall Street Journal, Professor Jeremy Bailenson, founding director of the Virtual Reality Human Interaction Lab at Stanford University, is using a state-of-the-art “haptic” floor of aeronautic metal that vibrates and moves to stimulate the physical world for research on how VR has the potential to change the way users feel and behave. For example, spending time flying around the world like Superman in virtual reality has been shown to increase participants’ altruistic actions outside of the lab. There may also be implications for confronting racism, sexism, and aiding in empathy and humanitarian efforts, says Bailenson. (see more in about empathy and VR in this IMS blog: https://blog.stcloudstate.edu/ims/2015/11/18/immersive-journalism/)
2. For coding and 3D design:
a class on virtual reality that gives students the opportunity to design their own interactive world, work with 3D audio and experiment with immersive technology through a combination of hands-on learning and case studies. Also, the University of Georgia is offering similar classes where students design and explore applications for VR.
3. For anatomy and dissection:
4. For engagement: A whopping 68 percent of survey respondents said the major benefit of using VR in education is to excite students about the subject matter. 39 percent said it’s great for encouraging creativity.