U-Spatial is pleased to announce the 2016 University of Minnesota Summer Spatial Boot Camp, an intensive, five-day geospatial workshop held on the University of Minnesota, Twin Cities campus from June 6th to 10th, 2016. Over the course of five days, participants will learn the fundamentals of Remote Sensing, GPS, LiDAR, Cartography, and more. Emphasis is on foundational skills in gathering, creating, managing, analyzing, and communicating spatial data. In addition to short courses, guest speakers will present on applications of geospatial tools and techniques.
Prerequisites
Working knowledge of Geographic Information Systems (GIS) is a prerequisite for admission to the workshop. In particular, familiarity with ArcGIS or comparable software packages is required.
Course Fees
The non-refundable participation fee for the entire workshop is $250.
Accommodation
U-Spatial has reserved a block of single-occupancy rooms in an on-campus dormitory at a rate of $46.95/night.
This course will introduce students to a range of techniques for analyzing and presenting spatial data in the humanities. We’ll start with a survey of popular GUI-based tools (Neatline, Google Fusion Tables, CartoDB, QGIS, etc), exploring both their capabilities and their limitations. Motivated by the gaps in existing software, the last part of the course will consist of a basic introduction to web map programming in the browser, making use of popular open-source libraries like Leaflet, d3, and Turf.js. Along the way, we’ll touch on the basic concepts needed to get up and running with front-end software development – HTML, CSS, Javascript, and more. This course is designed for enthusiastic beginners who are looking to learn about new tools and and get started with the basic skills needed to create custom GIS applications. No previous programming experience is required.
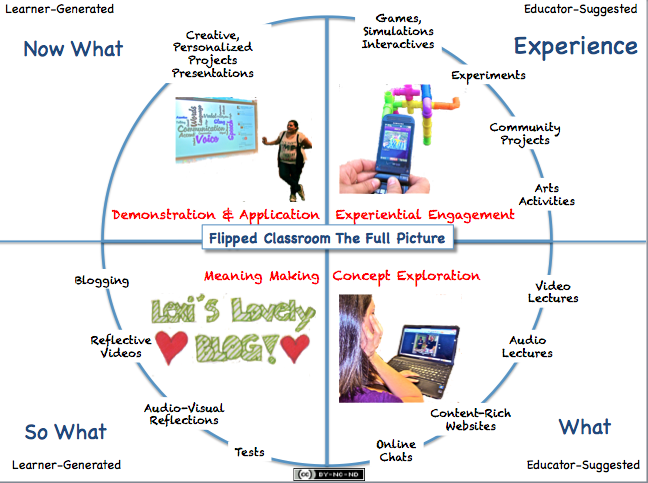
Flipped classroom is an instructional strategy and a type of blended learning that reverses the traditional educational arrangement by delivering instructional content, often online, outside of the classroom.
In essence, “flipping the classroom” means that students gain first exposure to new material outside of class, usually via reading or lecture videos, and then use class time to do the harder work of assimilating that knowledge, perhaps through problem-solving, discussion, or debates.
I have a long way to go in my skill set in making the videos interesting (they, to me anyway, are really boring to watch).
I’m not sure how much they (the videos) are being utilized. There are just certain items that are learned better through direct one on one contact.
I know as I’m teaching, I get direct feedback from my students by looking at their faces and gauging comprehension. I, as a teacher, don’t get that feedback as I’m designing and creating my videos.”
although learning styletheories serve as a justification for different learning activities it does not provide the necessarytheoretical framework as to how the activities need to be structured (Bishop and Verleger, 2013). p. 99
One observation from the literature is there is a lack of consistency of models of the FCM (Davieset al.,2013, p. 565) in addition to a lack of research into student performance, (Findlay-Thompson andMombourquette, 2014, p. 65; Euniceet al., 2013) broader impacts on taking up too much of thestudents’time and studies of broader student demographics. In another literature review of the FCM,Bishop and Verleger concur with the observation that there is a lack of consensus as to the definitionof the method and the theoretical frameworks (Bishop and Verleger, 2013). p. 99
The FCM isheavily reliant on technology and this is an important consideration for all who consideremploying the FCM. p. 101
Gross, B., Marinari, M., Hoffman, M., DeSimone, K., & Burke, P. (2015). Flipped @ SBU: Student Satisfaction and the College Classroom. Educational Research Quarterly, 39(2), 36-52.
we found that high levels of student engagement and course satisfaction characterised the students in the flipped courses, without any observable reduction in academic performance.
Hotle, S. L., & Garrow, L. A. (2016). Effects of the Traditional and Flipped Classrooms on Undergraduate Student Opinions and Success. Journal Of Professional Issues In Engineering Education & Practice, 142(1), 1-11. doi:10.1061/(ASCE)EI.1943-5541.0000259
It was found that student performance on quizzes was not significantly different across the traditional and flipped classrooms. A key shortcoming noted with the flipped classroom was students’ inability to ask questions during lectures. Students in flipped classrooms were more likely to attend office hours compared to traditional classroom students, but the difference was not statistically significant.
Heyborne, W. H., & Perrett, J. J. (2016). To Flip or Not to Flip? Analysis of a Flipped Classroom Pedagogy in a General Biology Course. Journal Of College Science Teaching, 45(4), 31-37.
Although the outcomes were mixed, regarding the superiority of either pedagogical approach, there does seem to be a trend toward performance gains using the flipped pedagogy. We strongly advocate for a larger multiclass study to further clarify this important pedagogical question.
Tomory, A., & Watson, S. (2015). Flipped Classrooms for Advanced Science Courses. Journal Of Science Education & Technology, 24(6), 875-887. doi:10.1007/s10956-015-9570-8
Instruction and Liaison Librarian, University of Northern Iowa
games and gamification. the semantics are important. using the right terms can be crucial in the next several years.
gamification for the enthusiasm. credit course with buffet. the pper-to-peer is very important
gaming types
affordability; east to use; speed to create.
assessment. if you want heavy duty, SPSS kind of assessment, use polldaddy or polleverywhere.
Kahoot only Youtube, does not allow to upload own video or use Kaltura AKA Medispace, text versus multimedia
Kahoot is replacing Voicethread at K12, use the wave
Kahoot allows to share the quizzes and surveys
Kahoot is not about assessment, it is not about drilling knowledge, it is about conversation starter. why do we read an article? there is no shame in wrong answer.
the carrot: when they reach the 1000 points, they can leave the class
Kahoot music can be turned off, how short, the answers are limited like in Twitter
Quizlet
screenshot their final score and reach 80%
gravity is hard, scatter start with. auditory output
drill game
Teach Challenge.
1st day is Kahoot, second day is Team challange and test
embed across the curriculum
gaming toolkit for campus
what to take home: have students facing students from differnt library
In the age of Big Data, there is an abundance of free or cheap data sources available to libraries about their users’ behavior across the many components that make up their web presence. Data from vendors, data from Google Analytics or other third-party tracking software, and data from user testing are all things libraries have access to at little or no cost. However, just like many students can become overloaded when they do not know how to navigate the many information sources available to them, many libraries can become overloaded by the continuous stream of data pouring in from these sources. This session will aim to help librarians understand 1) what sorts of data their library already has (or easily could have) access to about how their users use their various web tools, 2) what that data can and cannot tell them, and 3) how to use the datasets they are collecting in a holistic manner to help them make design decisions. The presentation will feature examples from the presenters’ own experience of incorporating user data in decisions related to design the Bethel University Libraries’ web presence.
data tools: user testing, google analytics, click trakcer vendor data
user testing, free, no visualization, cross-domain, easy to use, requires scripts
qualitative q/s : why people do what they do and how will users think about your content
3 versions: variables: options on book search and order/wording of the sections in the articles tab
Findings: big difference between tabs versus single-page. Lil difference btw single-page options. Take-aways it won’t tell how to fix the problem, how to be empathetic how the user is using the page
Like to do in the future: FAQ and Chat. Problem: low use. Question how to make it be used (see PPT details)
Crazy Egg – Click Trackers. not a free tool, lowest tier, less $10/m.
see PPT for details>
interaction with the pates, clicks and scrollings
scroll analytics
not easy to use, steep learning curve
“blob” GAnalytics recognize the three different domains that r clicked through as one.
vendor data: springshare
chat and FAQ
Libguides
questions:
is there a dashboard tool that can combine all these tools?
optimal workshop: reframe, but it is more about qualitative data.
how long does it take to build this? about two years in general, but in the last 6 months focused.
The 24-hour event brought together participants from area colleges studying not just computer science or engineering but also business, biotech, communications and graphic design. Students worked individually or in teams of four to develop applications for either of two recipients.
One is Catholic Charities, where coders were encouraged to improve one of its many services and programs for “very low income people.” For example, the students could come up with apps for improving the organization’s existing job skills training, immigration test training or nutrition information programs.
The other is VillageTech, a company that has created Looma, a low-power, affordable portable computer and projector box for classroom use in schools in developing countries. There, the hackers are supposed to come up with apps for use by students in Nepal, such as creating a content management and navigation system, to build an on-screen keyboard, to add to the maps available for Looma, to improve the speech capability, to create a tool for managing the webcam and related functions.
Join Mario Callegaro, Senior Survey Research Scientist at Google UK, and one of own survey research scientists, Sarah Cho, on February 24 at 10 am PT / 1 pm ET for our webinar, Market research surveys gone mobile: Optimizing for better results.
Mario Callegaro
Senior Survey Research Scientist
Quantitative Marketing Team, Google UK
Sarah Cho
Survey Research Scientist
SurveyMonkey
.My notes from the Webinar.
Surveys uncover the WHY. Big Data,
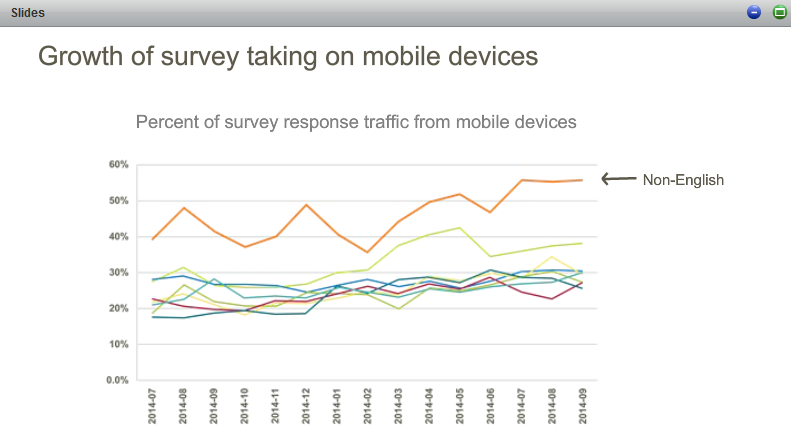
why mobile matters. tablet and smart phone penetration: around 60-80% in Europe. According to Pew In the US, 68% smartphone and 45% tablet
faster reaction but longer questionnaire completion time on smartphones = device effects
survey design device vs. survey take device – mismatch. When there is a mismatch, questions are asked.
5 strategies to handle mobile phone respondents: 1. do nothing
surveym0nkey: do all surveys have to be mobile optimized? no, so make sure you think about the context in which you are sending out
2. discourage the use of mobile phones for answering 3. optimize the web questionnaire for mobile browsers 4. mobile app
design considerations for multiple devices surveys. two “actors”: survey designer and survey platform
confounds when interpreting findings across devices: use homogeneous population (e.g students)
difference between mouse vs fingers as input devices
what about tablets: as long as flash is not used, tablet is very much the same as laptop/desktop. phablets (iPhone growth of the screen)
mobile survey design tips (Sarah)
multiple choice: ok to use, but keep wording short, format response vertically instead of horizontally.
open-ended q type: hard to type (but no word on voice recognition???)
logo
multimedia: images, clarity, video, avoid (bandwidth constrains), use Youtube, so every device can play it, versus Flash, Java Script etc