The data shared in June by the Office for Civil Rights, which compiled it from a 2013-2014 survey completed by nearly every school district and school in the United States. new is a report from Attendance Works and the Everyone Graduates Center that encourages schools and districts to use their own data to pinpoint ways to take on the challenge of chronic absenteeism.
The first is research that shows that missing that much school is correlated with “lower academic performance and dropping out.” Second, it also helps in identifying students earlier in the semester in order to get a jump on possible interventions.
The report offers a six-step process for using data tied to chronic absence in order to reduce the problem.
The first step is investing in “consistent and accurate data.” That’s where the definition comes in — to make sure people have a “clear understanding” and so that it can be used “across states and districts” with school years that vary in length. The same step also requires “clarifying what counts as a day of attendance or absence.”
The second step is to use the data to understand what the need is and who needs support in getting to school. This phase could involve defining multiple tiers of chronic absenteeism (at-risk, moderate or severe), and then analyzing the data to see if there are differences by student sub-population — grade, ethnicity, special education, gender, free and reduced price lunch, neighborhood or other criteria that require special kinds of intervention.
Step three asks schools and districts to use the data to identify places getting good results. By comparing chronic absence rates across the district or against schools with similar demographics, the “positive outliers” may surface, showing people that the problem isn’t unstoppable but something that can be addressed for the better.
Steps five and six call on schools and districts to help people understand why the absences are happening, develop ways to address the problem.
After surveying more than 4,650 educators, we learned that teachers are essentially trying to do three things with data—each of which technology can dramatically improve:
The U.S. Department of Education has increasingly encouraged and funded states to collect and analyze information about students: grades, state test scores, attendance, behavior, lateness, graduation rates and school climate measures like surveys of student engagement.
The argument in favor of all this is that the more we know about how students are doing, the better we can target instruction and other interventions. And sharing that information with parents and the community at large is crucial. It can motivate big changes.
what might be lost when schools focus too much on data. Here are five arguments against the excesses of data-driven instruction.
The National Education Policy Center releases annual reports on commercialization and marketing in public schools. In its most recent report in May, researchers there raised concerns about targeted marketing to students using computers for schoolwork and homework. Companies like Google pledge not to track the content of schoolwork for the purposes of advertising. But in reality these boundaries can be a lot more porous. For example, a high school student profiled in the NEPC report often consulted commercial programs like dictionary.com and Sparknotes: “Once when she had been looking at shoes, she mentioned, an ad for shoes appeared in the middle of a Sparknotes chapter summary.”
4) Missing What Data Can’t Capture
Computer systems are most comfortable recording and analyzing quantifiable, structured data. The number of absences in a semester, say; or a three-digit score on a multiple-choice test that can be graded by machine, where every question has just one right answer.
5) Exposing Students’ “Permanent Records”
In the past few years several states have passed laws banning employers from looking at the credit reports of job applicants. Employers want people who are reliable and responsible. But privacy advocates argue that a past medical issue or even a bankruptcy shouldn’t unfairly dun a person who needs a fresh start.
“Schools are beginning to use data and analytics (D&A) to enhance areas such as enrollment, budgeting and fundraising,” according to “Embracing Innovation,” KPMG’s 2015-2016 Higher Education Industry Outlook Survey of 102 senior higher education leaders
An April 2015 white paper from Oracle, “Improving Higher Education Performance with Big Data,” points to diverse use cases that could drive D&A initiatives, from student acquisition and retention to research optimization to operational efficiency.
The U.S. Bureau of Labor Statistics backs that up, predicting that employment of statisticians will grow 34 percent between 2014 and 2024. Not surprisingly, the bureau notes, that is “much faster than the average for all occupations.”
There are only 11 education-focused firms listed on the U.S. stock market with a market cap of over $1 billion. While the market is small and fractured today, GSV Capital estimates that education will grow from 9 percent to 12 percent of America’s GDP over the next decade. This equates to a trillion-dollar opportunity.
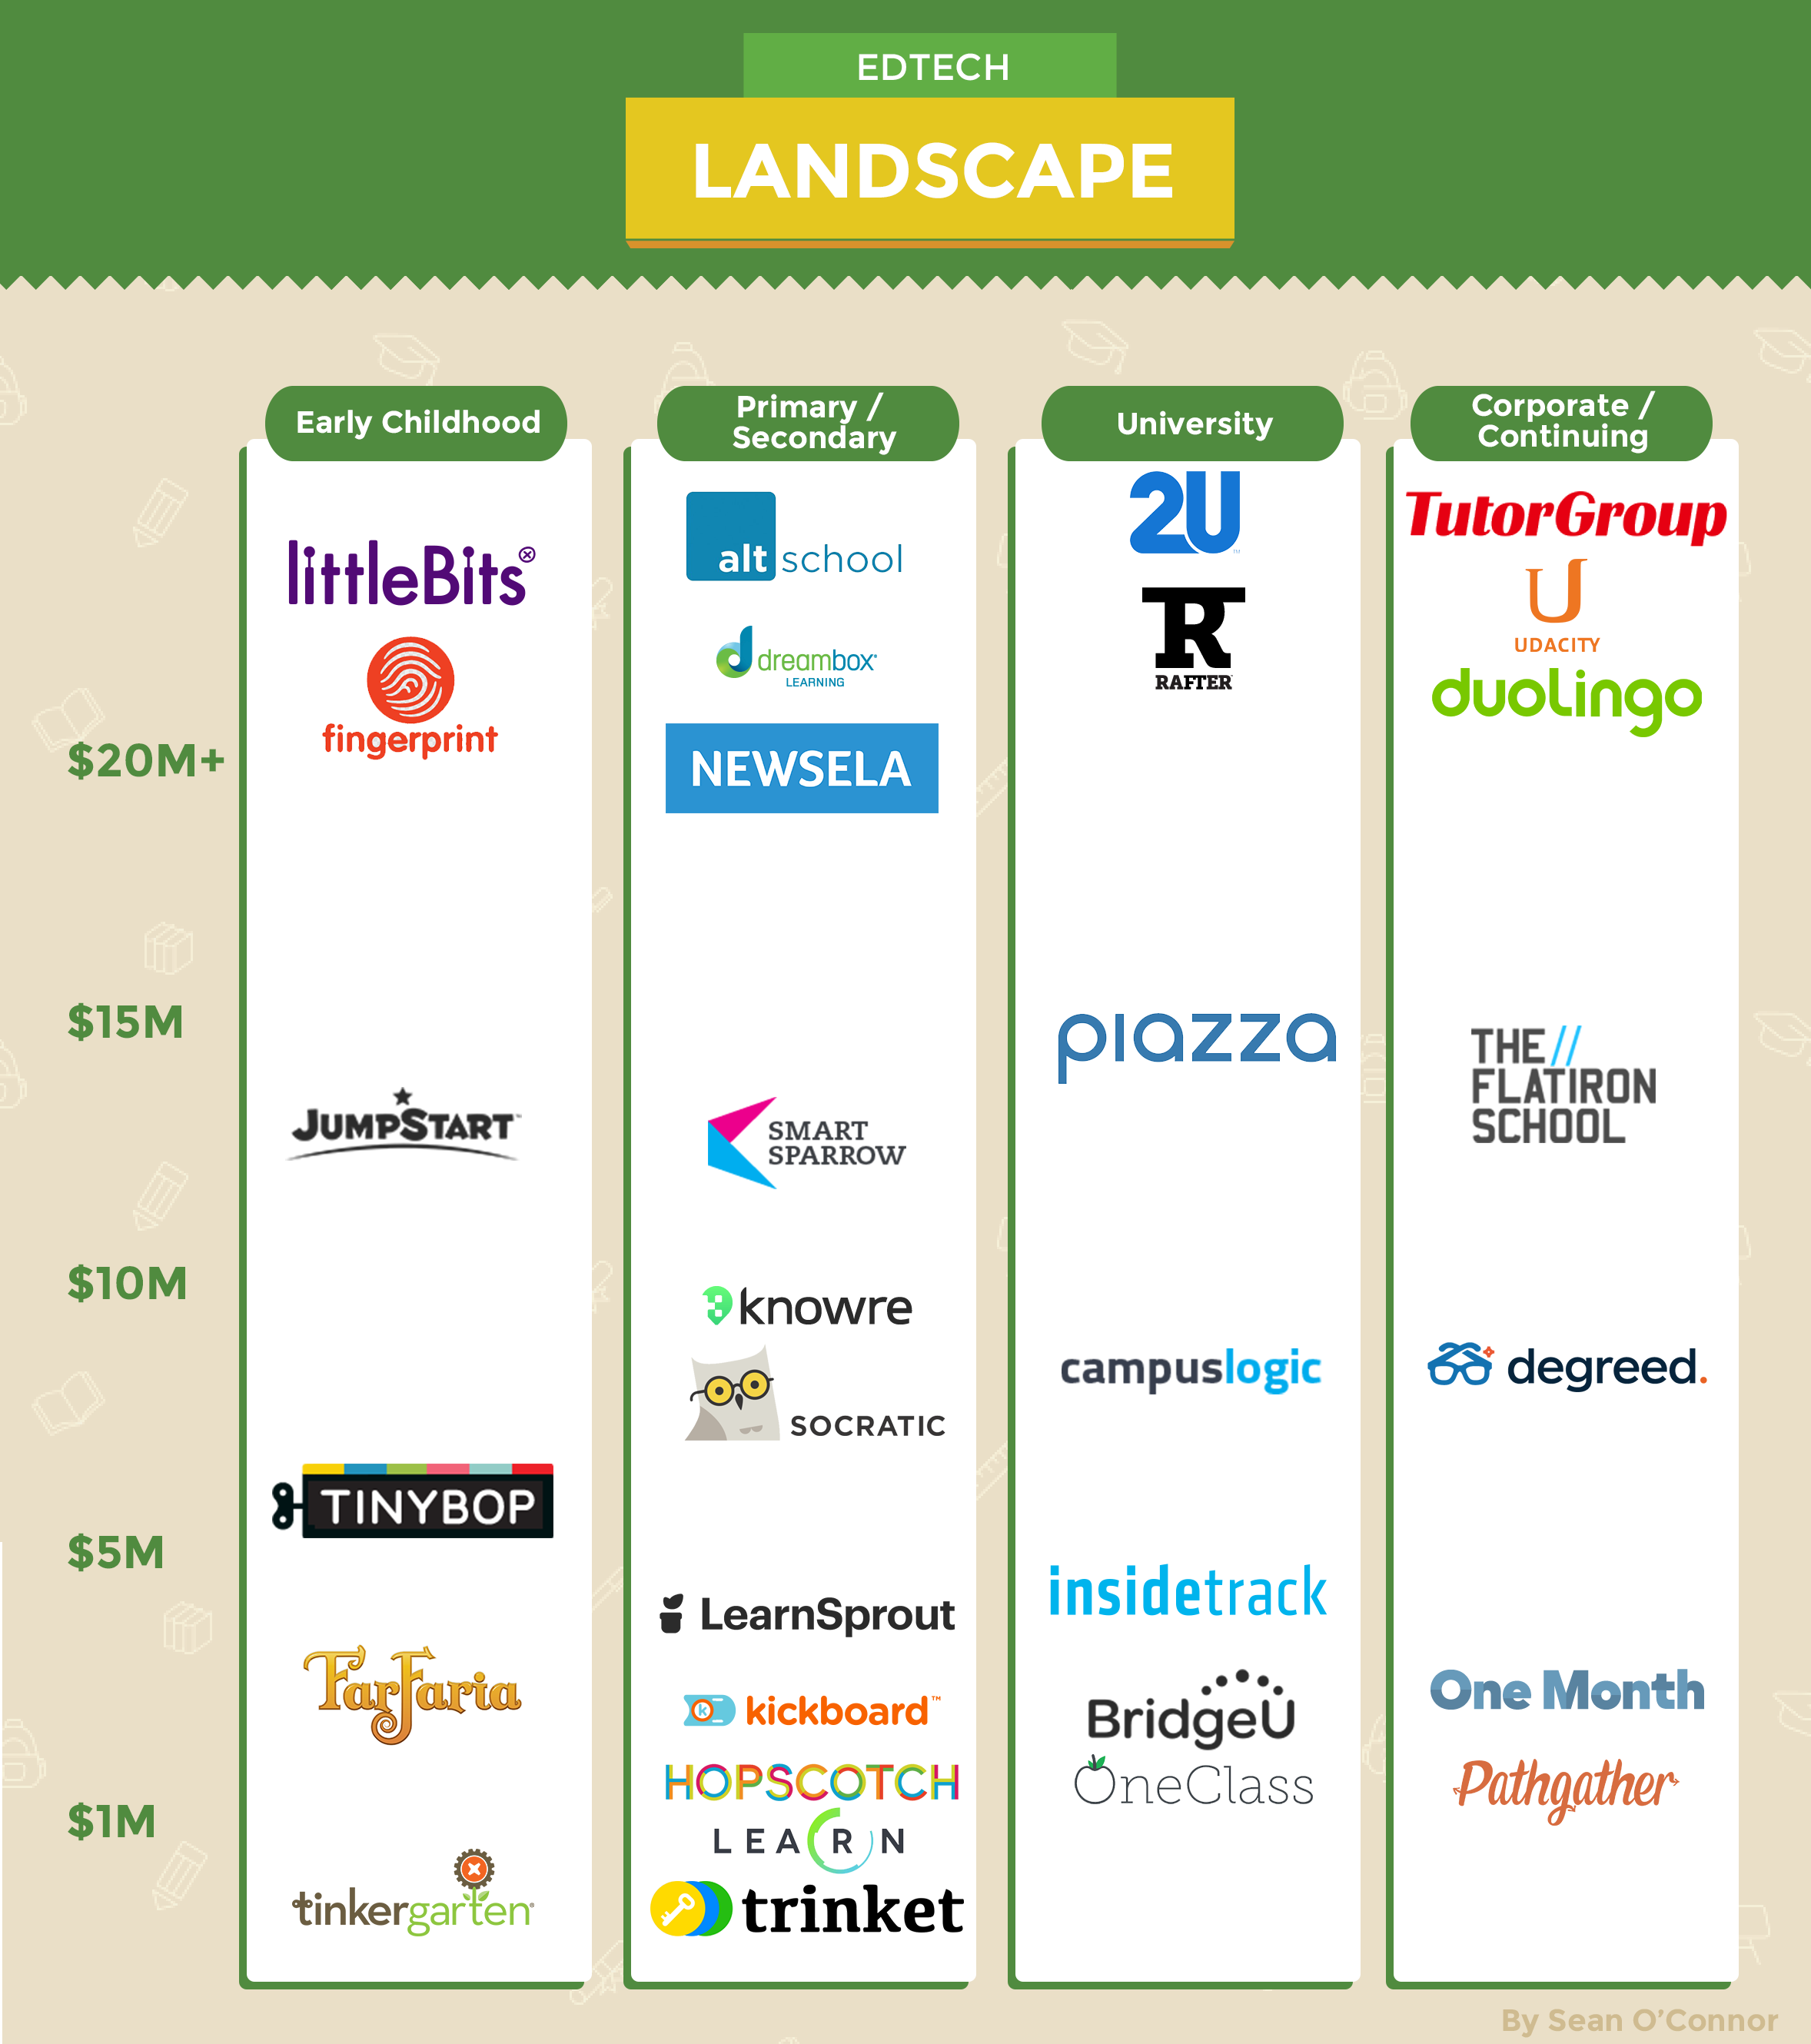
Early childhood
FarFaria: FarFaria is a literacy tool that offers families a vast library of books that are perfect for story time. Parents can go through the books with their son or daughter, or children can have the books read to them by the app.
Tinybop: Tinybop creates iOS apps that engage children and promote curiosity in kids. Their apps break down complex subjects (like geology and anatomy) into engaging apps that are filled with stunning illustrations.
Vroom: Vroom is a new app that pushes helpful tips to parents on how to turn everyday moments in life into brain-building opportunities. Vroom sends parents actionable tips and strategies that are age-appropriate for their child.
Tinkergarten: Tinkergarten helps kids develop and grow through outdoor-play-based learning and activities. They have a technology-enabled, distributed workforce that allows them to expand their classes across the United States.
Primary/secondary school
+++++++++++++++++++++
My Note:
“although 95 percent of schools have Internet, only 20 percent have high-speed access. For technology to disrupt our schools, we need to get them connected.”
yet, MN government is right now quarreling about fast-connection networking rural parts of Minnesota, whereas the Republicans insist on $30 Mil only, Democrats on $80Mil and the governor on $100K+.
In 2002, the U.S. created the conditions for monopoly in the Internet services providers market, which accumulates to disastrous results. The fight around net neutrality proves one more time that trend (of monopolizing connectivity and profiteering for big companies, rather then developing the US): http://www.npr.org/sections/alltechconsidered/2014/02/06/272480919/when-it-comes-to-high-speed-internet-u-s-falling-way-behind
++++++++++++++++++++++
Trend: One of the major developments in primary and secondary education is the focus on personalization. Students get pushed material that meets them where they are, when they need it. Classes can now adapt to a learner’s needs and provide them with the skills, the instruction and the resources they need to master concepts.
AltSchool: AltSchool was started in 2013 and is rethinking the way school works. Their technology platform enables teachers to create weekly “learning playlists” for each student. They’ve done away with formal classes and focus on group projects and individualized instruction.
CK-12: The CK-12 Foundation serves tens of thousands of schools and millions of students by providing free customizable learning tools and content. Students can use their interactive simulations and adaptive problem sets and teachers can customize their flexbooks.
DreamBox: DreamBox powers more than 5 million math lessons every week through their adaptive K-8 math platform. The platform continually assesses a student’s strengths and weaknesses to close gaps and meet students with the right material at the right time.
Trinket: Trinket lets teachers and students write, run and share code from any device. Trinkets can be easily adapted to the classroom and shared with students to run real-time coding challenges.
University
College is expensive in America; the average cost is more than $20,000 a year for a four-year degree. At least 65 percent of the 55 million new jobs forecasted for the next decade will require a formal post-secondary credential.
In 2015, only 50 percent of college graduates were working in the field they studied, and more than one-third indicated they would have chosen a different major. Nearly 40 percent of college graduates believed their school did not prepare them well for employment.
Students are going to university because it is “the right thing to do,” often without a thought to the ROI on their education or the work opportunities after school. Only 19 percent of full-time college students graduate in four years, which dramatically increases the cost of their degree.
Trend: Online platforms are being leveraged at universities to help drive down the cost of a degree and increase access to programs. Big data platforms are being used to identify students in danger of failing and provide targeted assistance to help them graduate on time.
Rafter: Rafter is redesigning textbooks at universities by repackaging course materials. They’ve helped almost 3 million students save more than $700 million on textbooks.
2U: 2U offers schools as a service by providing universities with a platform to create online degree programs. They have more than 500 faculty, 1,000 course sections and 1,600 hours of live instruction per week.
Corporate/continuing education
Trends: The two largest sectors for investment are skill training (primarily coding and digital literacy) and English language learning.
Degreed: Degreed provides a personal knowledge portfolio that stays with learners. They’ve cataloged 250,000+ online learning courses and 3 million-plus informal learning activities. They also help large companies understand the talent and skills within their organization.
Duolingo: Duolingo is a gamified language learning app that has more than 100 million users. They offer free instruction and are helping non-native English speakers certify their skills with affordable online testing.
Pathgather: Pathgather is an enterprise LMS that motivates employees to learn and connect around professional development.
iTutorGroup: iTutorGroup is a Chinese-based English language platform that began by offering English language training to corporate executives and has expanded to offer online courses for children and younger learners. They recently raised a Series C valuing them at more than $1 billion.
One Month: One Month offers technical-skills crash courses designed to give learners functional skills in 15 minutes a day for one month. Since starting, they’ve helped more than 25,000 students develop foundational technical skills.
altMBA: altMBA is an intensive, four-week online workshop designed by Seth Godin for high-performing individuals who want to level up and lead. They are rethinking the structure of learning online and have seen a 98 percent completion rate for their program.
ACRL e-Learning webcast series: Learning Analytics – Strategies for Optimizing Student Data on Your Campus
This three-part webinar series, co-sponsored by the ACRL Value of Academic Libraries Committee, the Student Learning and Information Committee, and the ACRL Instruction Section, will explore the advantages and opportunities of learning analytics as a tool which uses student data to demonstrate library impact and to identify learning weaknesses. How can librarians initiate learning analytics initiatives on their campuses and contribute to existing collaborations? The first webinar will provide an introduction to learning analytics and an overview of important issues. The second will focus on privacy issues and other ethical considerations as well as responsible practice, and the third will include a panel of librarians who are successfully using learning analytics on their campuses.
Webcast One: Learning Analytics and the Academic Library: The State of the Art and the Art of Connecting the Library with Campus Initiatives
March 29, 2016
Learning analytics are used nationwide to augment student success initiatives as well as bolster other institutional priorities. As a key aspect of educational reform and institutional improvement, learning analytics are essential to defining the value of higher education, and academic librarians can be both of great service to and well served by institutional learning analytics teams. In addition, librarians who seek to demonstrate, articulate, and grow the value of academic libraries should become more aware of how they can dovetail their efforts with institutional learning analytics projects. However, all too often, academic librarians are not asked to be part of initial learning analytics teams on their campuses, despite the benefits of library inclusion in these efforts. Librarians can counteract this trend by being conversant in learning analytics goals, advantages/disadvantages, and challenges as well as aware of existing examples of library successes in learning analytics projects.
Learn about the state of the art in learning analytics in higher education with an emphasis on 1) current models, 2) best practices, 3) ethics, privacy, and other difficult issues. The webcast will also focus on current academic library projects and successes in gaining access to and inclusion in learning analytics initiatives on their campus. Benefit from the inclusion of a “short list” of must-read resources as well as a clearly defined list of ways in which librarians can leverage their skills to be both contributing members of learning analytics teams, suitable for use in advocating on their campuses.
student’s opinion of this process
benefits: self-assessment, personal learning, empwerment
analytics and data privacy – students are OK with harvesting the data (only 6% not happy)
8 in 10 are interested in personal dashboard, which will help them perform
Big Mother vs Big Brother: creepy vs helpful. tracking classes, helpful, out of class (where on campus, social media etc) is creepy. 87% see that having access to their data is positive
librarians:
recognize metrics, assessment, analytics, data. visualization, data literacy, data science, interpretation
INSTRUCTION DEPARTMENT – N.B.
determine who is the key leader: director of institutional research, president, CIO
who does analyics services: institutional research, information technology, dedicated center
analytic maturity: data drivin, decision making culture; senior leadership commitment,; policy supporting (data ollection, accsess, use): data efficacy; investment and resourcefs; staffing; technical infrastrcture; information technology interaction
student success maturity: senior leader commited; fudning of student success efforts; mechanism for making student success decisions; interdepart collaboration; undrestanding of students success goals; advising and student support ability; policies; information systems
developing learning analytics strategy
understand institutional challenges; identify stakeholders; identify inhibitors/challenges; consider tools; scan the environment and see what other done; develop a plan; communicate the plan to stakeholders; start small and build
ways librarians can help
idenfify institu partners; be the partners; hone relevant learning analytics; participate in institutional analytics; identify questions and problems; access and work to improve institu culture; volunteer to be early adopters;
questions to ask: environmental scanning
do we have a learning analytics system? does our culture support? leaders present? stakeholders need to know?
questions to ask: Data
questions to ask: Library role
learning analytics & the academic library: the state of the art of connecting the library with campus initiatives
questions:
literature
7 Things You Should Know About First-Generation Learning Analytics. Published:
Barneveld, A., Arnold, K., & Campbell, J. (2012). Analytics in Higher Education: Establishing a Common Language. Educause Learning Initiative. Retrieved from http://net.educause.edu/ir/library/pdf/ELI3026.pdf
causation versus correlation studies. speakers claims that it is difficult to establish causation argument. institutions try to predict as accurately as possible via correlation, versus “if you do that it will happen what.”
real-time impact on curriculum structure, instruction delivery and student learning, permitting change and improvement. It can also provide insight into important trends that affect present and future resource needs.
Big Data: Traditionally described as high-volume, high-velocity and high-variety information.
Learning or Data Analytics: The measurement, collection, analysis and reporting of data about learners and their contexts, for purposes of understanding and optimizing learning and the environments in which it occurs.
Educational Data Mining: The techniques, tools and research designed for automatically extracting meaning from large repositories of data generated by or related to people’s learning activities in educational settings.
Predictive Analytics: Algorithms that help analysts predict behavior or events based on data.
Predictive Modeling: The process of creating, testing and validating a model to best predict the probability of an outcome.
Data analytics, or the measurement, collection, analysis and reporting of data, is driving decisionmaking in many institutions. However, because of the unique nature of each district’s or college’s data needs, many are building their own solutions.
For example, in 2014 the nonprofit company inBloom, Inc., backed by $100 million from the Gates Foundation and the Carnegie Foundation for the Advancement of Teaching, closed its doors amid controversy regarding its plan to store, clean and aggregate a range of student information for states and districts and then make the data available to district-approved third parties to develop tools and dashboards so the data could be used by classroom educators.22
Tips for Student Data Privacy
Know the Laws and Regulations
There are many regulations on the books intended to protect student privacy and safety: the Family Educational Rights and Privacy Act (FERPA), the Protection of Pupil Rights Amendment (PPRA), the Children’s Internet Protection Act (CIPA), the Children’s Online Privacy Protection Act (COPPA) and the Health Insurance Portability and Accountability Act (HIPAA)
— as well as state, district and community laws. Because technology changes so rapidly, it is unlikely laws and regulations will keep pace with new data protection needs. Establish a committee to ascertain your institution’s level of understanding of and compliance with these laws, along with additional safeguard measures.
Make a Checklist Your institution’s privacy policies should cover security, user safety, communications, social media, access, identification rules, and intrusion detection and prevention.
Include Experts
To nail down compliance and stave off liability issues, consider tapping those who protect privacy for a living, such as your school attorney, IT professionals and security assessment vendors. Let them review your campus or district technologies as well as devices brought to campus by students, staff and instructors. Finally, a review of your privacy and security policies, terms of use and contract language is a good idea.
Communicate, Communicate, Communicate
Students, staff, faculty and parents all need to know their rights and responsibilities regarding data privacy. Convey your technology plans, policies and requirements and then assess and re-communicate those throughout each year.
“Anything-as-a-Service” or “X-as-a-Service” solutions can help K-12 and higher education institutions cope with big data by offering storage, analytics capabilities and more. These include:
• Infrastructure-as-a-Service (IaaS): Providers offer cloud-based storage, similar to a campus storage area network (SAN)
• Platform-as-a-Service (PaaS): Opens up application platforms — as opposed to the applications themselves — so others can build their own applications
using underlying operating systems, data models and databases; pre-built application components and interfaces
• Software-as-a-Service (SaaS): The hosting of applications in the cloud
• Big-Data-as-a-Service (BDaaS): Mix all the above together, upscale the amount of data involved by an enormous amount and you’ve got BDaaS
Suggestions:
Use accurate data correctly
Define goals and develop metrics
Eliminate silos, integrate data
Remember, intelligence is the goal
Maintain a robust, supportive enterprise infrastructure.
Prioritize student privacy
Develop bullet-proof data governance guidelines
Create a culture of collaboration and sharing, not compliance.
Dartmouth College and the University of Texas at Austin have developed an app that tracks smartphone activity to compute a grade point average that’s within 0.17 of a point.
Metaverse Storefront Creators, Developers, and Operators
Metaverse Law Enforcement
DAO Attorneys
Cryptocurrency
Crypto Coaches and Advisors
Crypto Mortgage Specialists
Decentralization Managers
Healthcare
Amnesia Surgeons – Doctors who are skilled in removing bad memories or destructive behavior.
Memory Augmentation Therapists – Entertainment is all about the great memories it creates. Creating a better grade of memories can dramatically change who we are and pave the way for an entirely new class of humans.
Digital Implant Architects
Genetic Troubleshooters
Body Part Fabricators
AI Health Managers
Big Data
Privacy Strategists
Personal Data Managers, Archivists, and Protectors
Institutions of higher education have a chance to play a role in transforming the outdated perception of what college is–via strategies including upskilling
There is a greater need than ever before to provide increasingly specialized disciplinary knowledge, coupled with advanced workforce skills, without diminishing the role and importance of a broad-based education that ensures critical thinking and analytical reasoning along with social and communications skills and understanding. Simultaneously, in the context of millions of employees with some or no college and no degree, there is a need for academia to play an increased role in facilitating the continued employability of people already in the workforce through short-term credentials and certifications, enabling an updating of their knowledge and skills base.
Coskilling: The integration of knowledge (broad based and specialized) and relevant job skills into degree programs so that both facets are mastered simultaneously requires that institutions of higher ed focus on four key aspects simultaneously: (a) Increase opportunities for students to gain a well-rounded education intertwined with professional skills; (b) Respond at a significantly faster pace to the needs of the job market and be better aligned with advances in technology and information; (c) Create more flexible and personalized pathways for students to convert knowledge and learning to skills that result in earnings capacity; and (d) Change the “stove pipe” structure between academe and the workplace to enable greater alignment between the curriculum and new areas of workforce need.
Coding and “skills-building” bootcamps, enhanced career development services, and credentials and certificates are increasingly being offered by community colleges and universities either by themselves, or in conjunction with, external entities. Some are forming partnerships with corporate giants such as Boeing, Amazon Web Services, Cisco, and Google,
Upskilling
a greater need for employees to be “upskilled–mastering new skills, developing an understanding of a higher level of use of technology, and operating in a highly data-driven world. While a portion of upskilling can be undertaken “on the job,” institutions of higher education have the responsibility and opportunity to develop new certificates and courses, both self-standing and stackable, towards post-baccalaureate degrees that will build on existing levels of knowledge and skill sets.
 by Amy Burroughs