LibTechConf
http://libtechconf.org/2017schedule/
The Next Generation of Library Orientation: http://libtechconf.org/2017schedule/
Please have a link to the presentation: https://tinyurl.com/vr360lib
#LTC2017 #vrlib
Join us online, Thursday, March 16, 2:15PM via:
Adobe Connect archived recording: http://scsuconnect.stcloudstate.edu/p7qm3hg7u0h/
or via
Facebook Live: https://www.facebook.com/InforMediaServices/
++++++++++++++++++++
more on LibTech conferences:
https://blog.stcloudstate.edu/ims?s=library+technology+conference
!!!!!!!!!!!!!!!!!!!!!!!!!!!!!!!!!!!!!!!!!!!!!!!!!!!!!!!!!!!!!!!!!!
notes from the conference
Keynote speaker: Lauren Di Monte http://sched.co/955P
Debating Data Science – a roundtable http://rhr.dukejournals.org/content/2017/127/133.abstract
Lauren
how data is produced, collected and analyzed. make accessible all kind of data and info
ask good q/s and find good answers, share finding in meaningful ways. this is where digital literacy overshadows information literacy and this the fact that SCSU library does not understand; besides teaching students how to find and evaluate data, I also teach them how to communicate effectively using electronic tools.
connecting people tools and resources and making it easier for everybody. building collaborative, open and interdisciplinary
robust data computational literates. developing workshops, project and events to practice new skills. to position the library as the interdisciplinary nexus
what are data: definition. items of information, facts, traces of content and form. higher level, conception discussion about data in terms of social effects: matadata capturing information about the world, social political and economic changes. move away the mystic conceptions about data. nothing objective about data.
the emergence of IoT – digital meets physical. cyber physical systems. smart objects driven by industry. . proliferation of sensor and device – smart devices.
what does privacy looks like ? what is netneutrality when IoT? library must restructure : collaborate across institutions about collections of data in opien and participatory ways. put IoT in the hands of make and break things (she is maker space aficionado)
make and break things hackathons – use cheap devices such as Arduino and Pi.
data literacy programs with higher level conception exploration; libraries empower the campus in data collection. data science norms, store and share data to existing repositories and even catalogs. commercial services to store and connect data, but very restrictive and this is why libraries must be involved.
linked data and dark data
linked data – draw connections around online data most of the data are locked. linked data uses metadata to link related information in ways computers can understand.
libraries take advantage of link data. link data opportunity for semantics, natural language processing etc. if hidden data is relative to our communities, it is a library responsibility to provide it. community data practitioners
dark data
massive data, which cannot be analyzed by relational processing. data not yield significant findings. might be valuable for researchers: one persons trash is another persons’ treasure. preserving data and providing access to info. collaborate with researchers across disciplines and assist decide what is worth keeping and what discarding and how to study.
rich learning experience working with lined and dark data enable fresh perspective and learning how to work with data architecture. data literacy programming.
open practices https://www.data.gov/
in context of data is different from open source and open projects. the social side of data science . advising researchers on navigation data, ethical compilations.
open science movement .https://cos.io/ pushing beyond licences and reframe, position ourselves as collaborators
analysis and publishing ; use tools that can be shared and include data, code and executable files.
reproducibility and contestability https://www.lib.ncsu.edu/events/series/summer-of-open-science
Python and Raspberry Pi. jupitor notebook server,
she is advocating for faculty not only being the leader but the DOERs of basic fucntions, which SCSU IT is rigorously fighting to keep for themselves. The sad part is that the rest of the nation is moving in this direction and SCSU continues to sink in an old 90ish campus structure of leaving IT as the gatekeeprs to functions now widely democratized.
public libraries: citizen science projects.
her undergrad is visual studies and her grad studies is interdisciplinary studies. only in the information school she got into science.
!!!!!!!!!!!!!!!!!!!!!!!!!!!!!!!!!!!!!!!!!!!!!!!
social media for the library
http://sched.co/954Z
!!!!!!!!!!!!!!!!!!!!!!!!!!!!!!!!!!!!!!!!!!!!!!!!!!!!!!!!
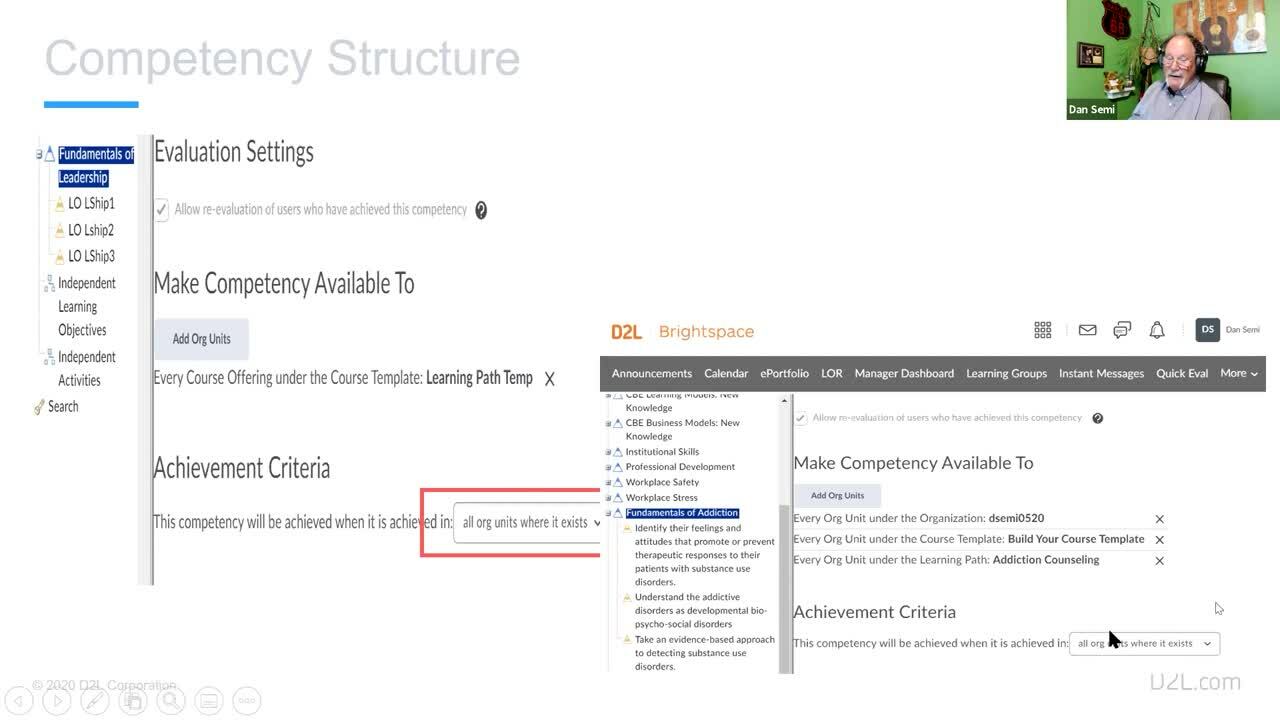
Library Website Redesign: Turning Awful into Awesome
http://sched.co/953o dysfunctional committee
Here is the Facebook Live link to the session:
lib guides versus curation : https://blog.stcloudstate.edu/ims/2016/12/06/digital-curation/
crazyegg:
Putting it all together: a holistic approach to utilizing your library’s user data for making informed web design decisions (2016 conference)
In the age of Big Data, there is an abundance of free or cheap data sources available to libraries about their users’ behavior across the many components that make up their web presence. Data from vendors, data from Google Analytics or other third-party tracking software, and data from user testing are all things libraries have access to at little or no cost. However, just like many students can become overloaded when they do not know how to navigate the many information sources available to them, many libraries can become overloaded by the continuous stream of data pouring in from these sources. This session will aim to help librarians understand 1) what sorts of data their library already has (or easily could have) access to about how their users use their various web tools, 2) what that data can and cannot tell them, and 3) how to use the datasets they are collecting in a holistic manner to help them make design decisions. The presentation will feature examples from the presenters’ own experience of incorporating user data in decisions related to design the Bethel University Libraries’ web presence.
http://tinyurl.com/jbchapf

!!!!!!!!!!!!!!!!!!!!!!!!!!!!!!!!!!!!!!!!!!!!!!!!
Making Something Out of Nothing: Building Digital Humanities Partnerships
Facebook Live https://www.facebook.com/InforMediaServices/videos/1136610906449405/
what is digital humanities?
3 questions to rotate the conversation around them
bit.ly/DHLibQ1
bit.ly/DHLibQ2
group discussions
silos, IT barrier, focusing on student success, retention, server space is cheap, if
promotion and tenure for faculty can include incentive to work with the librarian
being perceived as a “no” person
How can we can help one another build partnerships within and across institutions?
bit.ly/DHLibQ3
Midwest consortium for grants among liberal colleges to distribute support
!!!!!!!!!!!!!!!!!!!!!!!!!!!!!!!!!!!!
badges CSS and Java Script generate links, which can be used for the course
server is external so it is independent from IT constrains.
!!!!!!!!!!!!!!!!!!!!!!!!!!!!!!!!!!!!!!!!!!!!!!!!!!!!!!!!!!!
March 16
3d virtual picture of disastrous areas. unlock the digital information to be digitally accessible to all people who might be interested.
they opened the maps of Katmandu for the local community and they were coming up with the strategies to recover. democracy in action
http://werobotics.org/
mountain tsunami: http://www.natgeotv.com/uk/seconds-from-disaster/videos/mountain-tsunami
i can’t stop thinking that the keynote speaker efforts are mere follow up of what Naomi Klein explains in her Shock Doctrine: http://www.naomiklein.org/shock-doctrine: a government country seeks reasons to destroy another country or area and then NGOs from the same country go to remedy the disasters
A question from a librarian from the U about the use of drones. My note: why did the SCSU library have to give up its drone?
!!!!!!!!!!!!!!!!!!!!!!!!!!!!!!!!!!!!!!!!!!!!!!!!!!
http://sched.co/953l
Building an Ebook Platform from Scratch: Are You Daft?
Douglas County Library model. too resource intensive to continue
Marmot Library Network
ILS integrated library system – shared with other counties, same sever for the entire consortium. they have a programmer, viewfind, open source, discovery player, he customized viewfind community to viewfind plus. instead of using the ILS public access catalogue, they are using the Vufind interface
Caiifa Enki. public library – single access collection. they purchase ebooks from the publisher and they are using also the viewfind interface. but not integrated with the library catalogs. Kansas public library went from OverDrive to Viewfind. CA State library is funding for the time being this effort.
publisher agreement needed
metadata is a big issue. it can come in any format – spreadsheet, HTML and need to be able to convert into MARC
Amigos is a consortium of schools, but also academic and public. small public library could not handle the spreadsheet
types of content – publisher will not understand issue, which clear for librarians
PDF and epub formats
purchase content –
title by title selection – academia is tired of selections. although it is intended to buy also collections
library – owned ( and shared collections)
host content from libraries – papers in academic lib, genealogy in pub lib.
options in license models .
e resource content. not only ebooks, after it is taken care of, add other types of digital objects.
instead of replicate, replacement of the commercial aggregators,
Amigos Shelf interface is the product of the presenter
instead of having a young reader collection as SCSU has on the third floor, an academic library is outsourcing through AMigos shelf ebooks for young readers
purchasing marketing was built from scratch on PhP. https://laravel.com/
Harper Collins is too cumbersome and the reason to avoid working with them.
security issues. some of the material sent over ftp and immediately moved to sftp
decisions – use of internal resources only, if now – amazon
programmer used for the pilot. contracted programmers. lack of the ability to see the large picture. eventually hired a full time person, instead of outsourcing. RDA compliant MARC.
ONIX, spreadsheet MARC.
Decision about who to start with : public or academic.
attempt to keep pricing down –
own agreement with the customers, separate from the agreement with the Publisher
current development: web-based online reading, shared-consortial collections and SIP2 authentication
new CIO closed the project.
!!!!!!!!!!!!!!!!!!!!!!!!!!!!!!!!!!!!!!!!!!!!!
Tutorials
http://bit.ly/LTC2017SVC
https://docs.google.com/presentation/d/1FnlTJVdu4KkvjB21NXp82zHCYwQfmwpzi_dlZp4AgYU/edit#slide=id.p
http://bit.ly/LTC2017tutorial2
https://youtu.be/3MhsVN8ff0c
https://smaudience.surveymonkey.com/webinar-google-mobile-surveys.html
—
Join Mario Callegaro, Senior Survey Research Scientist at Google UK, and one of own survey research scientists, Sarah Cho, on February 24 at 10 am PT / 1 pm ET for our webinar, Market research surveys gone mobile: Optimizing for better results.
Mario Callegaro
Senior Survey Research Scientist
Quantitative Marketing Team, Google UK
Sarah Cho
Survey Research Scientist
SurveyMonkey
.My notes from the Webinar.
Surveys uncover the WHY. Big Data,
why mobile matters. tablet and smart phone penetration: around 60-80% in Europe. According to Pew In the US, 68% smartphone and 45% tablet
faster reaction but longer questionnaire completion time on smartphones = device effects
survey design device vs. survey take device – mismatch. When there is a mismatch, questions are asked.
5 strategies to handle mobile phone respondents: 1. do nothing
surveym0nkey: do all surveys have to be mobile optimized? no, so make sure you think about the context in which you are sending out
2. discourage the use of mobile phones for answering 3. optimize the web questionnaire for mobile browsers 4. mobile app
design considerations for multiple devices surveys. two “actors”: survey designer and survey platform
confounds when interpreting findings across devices: use homogeneous population (e.g students)
difference between mouse vs fingers as input devices
what about tablets: as long as flash is not used, tablet is very much the same as laptop/desktop. phablets (iPhone growth of the screen)
mobile survey design tips (Sarah)
multiple choice: ok to use, but keep wording short, format response vertically instead of horizontally.
open-ended q type: hard to type (but no word on voice recognition???)
logo
multimedia: images, clarity, video, avoid (bandwidth constrains), use Youtube, so every device can play it, versus Flash, Java Script etc
testing and length: as usual
URL: as short as possible. consider QR code
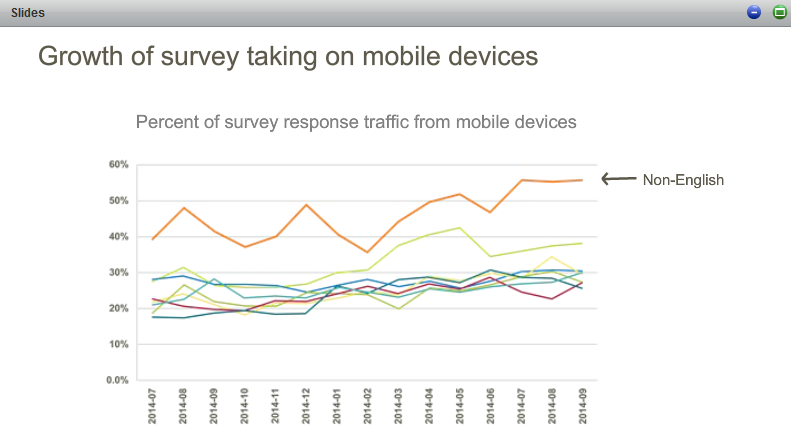
growth of survey taking on mobile devices
https://medium.com/@allisonjaiodell/why-i-left-academic-libraries-26e2a63c8bf2
Why I Left Libraries
Data Architecture: I was an active member of the RBMS Bibliographic Standards Committee, the ARLIS/NA Artists’ Books Thesaurus project, and an OCLC initiative on Web archiving metadata. I used to contribute to development of international schemas, controlled vocabularies, and content standards for free, as a service activity. Meanwhile, I could have earned $134,677 as a data architect.
Web Development: I developed applications and customized discovery layers to help library patrons find resources. I learned several markup and scripting languages in order to take on this extra work for the library, in the hot-hot pursuit of grant funding to list on my CV. I could have earned $88,285 as a front-end developer (the folks who use HTML, CSS, and JavaScript to build the parts of a website that you see), or $101,021 as a back-end developer (the folks who work with APIs, and transfer data to/from databases).
Data Engineering: Libraries are constantly integrating data from publishers, digitization projects, legacy catalogs, union catalogs, and more. I became a whizz at data wrangling and transformation. I developed countless data pipelines and ETL processes to combine disparate data streams. I should have been earning $112,935 as a data engineer.
User Experience Research: To inform cataloging guidelines, and to better design catalogs and finding aids to meet user needs, I spent a lot of time in libraries researching information-seeking behaviors. I became intimately familiar with Google Analytics and Google Tag Manager. I ran focus groups, conducted usability tests, and led card-sorting exercises in order to gather insights on how to improve our discovery interfaces and their navigation. As a user experience researcher outside of libraries, I could have earned $140,985.
Fundraising: As a special collections professional, I was routinely asked to give tours and host events, with the goal of building relationships with donors. I cultivated skills in storytelling, and learned to quickly craft narratives about my projects’ efficacy and impact. As an academic and a gig worker, I helped develop numerous grant applications, and served as a principal investigator on several large-sum projects. Overall, I honed techniques that are crucial to fundraising and philanthropy. In the nonprofit sector, I could have earned between $98,765 as a development manager and $102,546 as a director of development.
Project Management: In libraries, I never had less than five major projects going at once. I oversaw several large-scale database and website migrations, making sure that each of my team members’ contributions were completed in sequence and on time, while I myself served as a project contributor. In the tech sector, I could have been working as a project manager — someone whose sole job is to hold others accountable to the development timeline — and earned $87,086.