Searching for "online tools"
https://www.facebook.com/groups/onlinelearningcollective/permalink/576092676354768/
Are Colleges Ready for a Different Kind of Teaching This Fall?
By Beth McMurtrie May 05, 2020
https://www.chronicle.com/article/Are-Colleges-Ready-for-a/248710
Skeptical students and their parents don’t seem willing to pay full price for an experience similar to what they lived through this semester. If virtual learning is mandatory this fall, one survey found, two-thirds of students will expect discounts on tuition and fees. Some may avoid enrolling altogether.
Education experts who have been following higher education’s transition to remote learning say that colleges need to act now if they want to be fully prepared for the fall.
Colleges should start by evaluating what went well, and poorly, this spring, so they can start identifying gaps in training, planning, and technology, he says. They should also assess their campus resources to begin preparing instructors for the fall. They may find that instructional designers, academic-technology experts, and faculty members familiar with online tools and teaching are less effective because they are spread thinly across campus, not centrally deployed.
Effective online teaching, Wade says, depends more on building engagement than on mastering complicated technology.
At the University of Central Florida, Thomas B. Cavanagh, vice provost for digital learning, estimates that more than 80 percent of its 1,600 faculty members had received some form of professional development for teaching online before the coronavirus hit, ranging from self-paced training on how to use the learning-management system to the university’s 10-week online-course-design program. Given the need to rapidly prepare hundreds of instructors, says Cavanagh, the university is in the process of developing a streamlined three-week course, “essentials of online teaching,” through which it expects to train around 200 instructors. About 350 instructors will also take a short course called “teaching through lecture capture — Zoom edition,” he says.
Net Inlcusion 2019
https://netinclusion2019.sched.com/
Local Government Digital Equity Plans
Municipal governments are in the forefront of local, collaborative digital access and equity planning. Local leaders will talk about the value of planning, the nuts and bolts of making a plan, and the outcomes of their planning efforts.
This research shows that it is more inclusive communities that experience better economic outcomes; that digital inclusion leads to economic benefits at the community level. Disparities in broadband adoption over time also track the widening inequalities that have become apparent across regions and communities in the U.S., and digital inclusion is a necessary part of policy solutions for narrowing place-based gaps in economic opportunity.
New Tools and Materials for Digital Literacy Training and Assessment
Moderated discussion of the variety of approaches to digital literacy training and management: including the use of volunteers, class structures, certifications, use of online tools, curriculum, etc.
Finch, J. f., & Flenner, A. (2016). Using Data Visualization to Examine an Academic Library Collection. College & Research Libraries, 77(6), 765-778.
http://login.libproxy.stcloudstate.edu/login?qurl=http%3a%2f%2fsearch.ebscohost.com%2flogin.aspx%3fdirect%3dtrue%26db%3dllf%26AN%3d119891576%26site%3dehost-live%26scope%3dsite
p. 766
Visualizations of library data have been used to: • reveal relationships among subject areas for users. • illuminate circulation patterns. • suggest titles for weeding. • analyze citations and map scholarly communications
Each unit of data analyzed can be described as topical, asking “what.”6 • What is the number of courses offered in each major and minor? • What is expended in each subject area? • What is the size of the physical collection in each subject area? • What is student enrollment in each area? • What is the circulation in specific areas for one year?
libraries, if they are to survive, must rethink their collecting and service strategies in radical and possibly scary ways and to do so sooner rather than later. Anderson predicts that, in the next ten years, the “idea of collection” will be overhauled in favor of “dynamic access to a virtually unlimited flow of information products.” My note: in essence, the fight between Mark Vargas and the Acquisition/Cataloguing people
The library collection of today is changing, affected by many factors, such as demanddriven acquisitions, access, streaming media, interdisciplinary coursework, ordering enthusiasm, new areas of study, political pressures, vendor changes, and the individual faculty member following a focused line of research.
subject librarians may see opportunities in looking more closely at the relatively unexplored “intersection of circulation, interlibrary loan, and holdings.”
Using Visualizations to Address Library Problems
the difference between graphical representations of environments and knowledge visualization, which generates graphical representations of meaningful relationships among retrieved files or objects.
Exhaustive lists of data visualization tools include: • the DIRT Directory (http://dirtdirectory.org/categories/visualization) • Kathy Schrock’s educating through infographics (www.schrockguide.net/ infographics-as-an-assessment.html) • Dataviz list of online tools (www.improving-visualisation.org/case-studies/id=5)
Visualization tools explored for this study include Plotly, Microsoft Excel, Python programming language, and D3.js, a javascript library for creating documents based on data. Tableau Public©
Eugene O’Loughlin, National College of Ireland, is very helpful in composing the charts and is found here: https://youtu.be/4FyImh2G7N0.
p. 771 By looking at the data (my note – by visualizing the data), more questions are revealed, The visualizations provide greater comprehension than the two-dimensional “flatland” of the spreadsheets, in which valuable questions and insights are lost in the columns and rows of data.
By looking at data visualized in different combinations, library collection development teams can clearly compare important considerations in collection management: expenditures and purchases, circulation, student enrollment, and course hours. Library staff and administrators can make funding decisions or begin dialog based on data free from political pressure or from the influence of the squeakiest wheel in a department.
+++++++++++++++
more on data visualization for the academic library in this IMS blog
https://blog.stcloudstate.edu/ims?s=data+visualization
Teaching & Assessing Soft Skills
Communication in Person & Online (available in PDF format here: Communication in Person Online Rubric)
https://docs.google.com/document/d/16JVAivizIysXdmUVXzC2BP2NiclbJ21N9cOZQ6NdqxU/edit
| 1 |
2 |
3 |
4 |
| Limited, to no, participation in discussions.
Does not come to discussions prepared. As a result, fails to support statements with evidence from texts and other research.
Few attempts to ask questions or build on ideas shared.
Frequently violates the “dos and don’ts of online communication.” |
Limited participation in discussions (one-on-one, in groups, and teacher-led) with various partners.
Does not consistently come to discussions prepared. Limited preparation and inability to support statements with evidence from texts and other research reflects lack of preparation.
Limited attempts to ask questions, build on ideas shared, or invite quieter voices into the conversation.
Hesitant to respond to other perspectives and fails to summarize points or make connections.
Occasionally violates the “dos and don’ts of online communication.” |
Participates in a range of collaborative discussions (one-on-one, in groups, and teacher-led) with diverse partners.
Comes to discussions prepared, having read and researched material. Draws on that preparation by referring to evidence from texts and other research on the topic.
Attempts to drive conversations forward by asking questions, building on ideas shared, and inviting quieter voices into the conversation.
Responds to diverse perspectives, summarizes points, and makes connections.
Respects the “dos and don’ts for online communication.” |
Initiates and participates effectively in a range of collaborative discussions (one-on-one, in groups, and teacher-led) with diverse partners.
Comes to discussions prepared with a unique perspective, having read and researched material; explicitly draws on that preparation by referring to evidence from texts and other research on the topic.
Propels conversations by posing and responding to questions that relate to the current discussion. (Adds depth by providing a new, unique perspective to the discussion.)
Responds thoughtfully to diverse perspectives, summarizes points of agreement and disagreement, and makes new connections. Leans in and actively listens.
Makes eye contact, speaks loud enough to be heard, and body language is strong.
Respects the “dos and don’ts for online communication.” |
Critical Thinking & Problem Solving, (available in PDF format here: Critical Thinking Problem Solving Rubric)
https://docs.google.com/document/d/1fjlODmLvrVZyrKnzz54LbVa7CqfbAJvLfb98805fjuY/edit
| 1 |
2 |
3 |
4 |
| Reflects surface level understanding of information.
Unable or unwilling to evaluate quality of information or draw conclusions about information found.
Does not try to solve problems or help others solve problems. Lets others do the work.
Does not actively seek answers to questions or attempt to find information. Does not seek out peers or ask teacher for guidance or support. |
Attempts to dive below the surface when analyzing information but work lacks depth.
Struggles to evaluate the quality of information and does not draw insightful conclusions about information found.
Does not suggest or refine solutions, but is willing to try out solutions suggested by others.
Asks teachers or other students for answers but does not use online tools, like Google and YouTube, to attempt to answer questions or find information. |
Demonstrates a solid understanding of the information.
Evaluates the quality of information and makes inferences/draws conclusions.
Refines solutions suggested by others.
Attempts to use online tools, like Google and YouTube, to seek answers and find information. |
Demonstrates a comprehensive understanding of the information.
Effectively evaluates the quality of information and makes inferences/draws conclusion that are insightful.
Actively looks for and suggests solutions to problems.
Uses online tools, like Google and YouTube, to proactively seek answers and find information.
|
Collaboration & Contributions in a Team Dynamic (available in PDF format here: Collaboration Contributions in a Team Dynamic Rubric)
https://docs.google.com/document/d/1ucjgylXWz8nOM5Vq8FpTByur8smsbov3mR8pX-7n1SE/edit
| 1 |
2 |
3 |
4 |
| Fails to listen to, share with, and support the efforts of team members making accomplishing a task more difficult for the team.
Frequently inattentive or distracting when team members talk. Requires frequent redirection by team members and/or teacher.
Body language does not reflect engagement in the process. Focus on leaning in, asking questions, actively listening (e.g. make eye contact).
Rarely offers feedback. Frequently becomes impatient, frustrated, and/or disrespectful.
Limited attempts to move between roles.
Does not use resources to support the team’s work. |
Attempts to listen to, share with, and support the efforts of team members are limited or inconsistent.
Does not always listen when team members talk and requires redirection by team members and/or teacher.
Body language does not reflect engagement in the process. Focus on leaning in, asking questions, actively listening (e.g. make eye contact).
Occasionally offers feedback. At times, becomes impatient or frustrated with the process making teamwork more challenging.
Limited attempts to move between roles.
Does not consistently use resources to support the team’s work. |
Listens to, shares with, and supports the efforts of team members.
Listens when team members talk.
Attempts to engage in group tasks; however, body language does not consistently communicate interest or attention. Body language reflects engagement in the process, but there is room for improvement.
Offers feedback and treats team members with respect. At times, becomes impatient or frustrated with the process making teamwork more challenging.
Attempts to be flexible and move between roles; at times dominates a particular role. This is an area of potential growth.
Uses resources to support the team’s work. |
Consistently listens to, shares with, and supports the efforts of team members.
Leans in and actively listens when team members talk.
Body language communicates interest in team tasks and engagement in the process.
Offers constructive feedback, treats team members with respect, and is patient with the process.
Creates balance on the team moving between responsibilities without dominating any one role.
Uses resources effectively to support the team’s work. |
\++++++++++++++++++++++
more on soft skills in this IMS blog
https://blog.stcloudstate.edu/ims?s=soft+skills
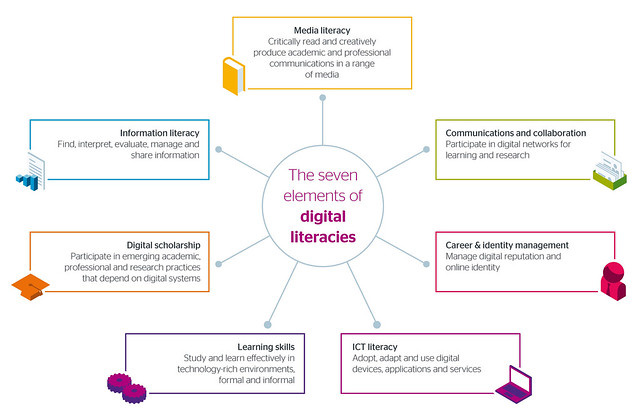
NMC Releases Second Horizon Project Strategic Brief on Digital Literacy
NMC Releases Second Horizon Project Strategic Brief on Digital Literacy
The New Media Consortium (NMC) has released Digital Literacy in Higher Education, Part II: An NMC Horizon Project Strategic Brief, a follow-up to its 2016 strategic brief on digital literacy.
PDF available here.
2017-nmc-strategic-brief-digital-literacy-in-higher-education-II-ycykt3
But what does it really mean to be digitally literate, and which standards do we use?” said Dr. Eden Dahlstrom, NMC Executive Director. “This report sheds light on the meaning and impact of digital literacy using cross-cultural and multi-disciplinary approaches, highlighting frameworks and exemplars in practice.
NMC’s report has identified a need for institutions and thought leaders to consider the ways in which content creation is unequally expressed throughout the world. In an examination of digital literacy within European, Middle Eastern, and African nations (EMEA), research has surfaced unequal access to information technology based on inequalities of economics, gender, race, and political divides.
| 2020 |
|
2015 |
|
| 1. |
Complex Problem Solving |
1. |
Complex Problem Solving |
| 2. |
Critical Thinking |
2. |
Coordinating with Others |
| 3. |
Creativity |
3. |
People Management |
| 4. |
People Management |
4. |
Critical Thinking |
| 5. |
Coordinating with Others |
5. |
Negotiation |
| 6. |
Emotional Intelligence |
6. |
Quality Control |
| 7. |
Judgment and Decision Making |
7. |
Service Orientation |
| 8. |
Service Orientation |
8. |
Judgment and Decision Making |
| 9. |
Negotiation |
9. |
Active Listening |
| 10. |
Cognitive Flexibility |
10. |
Creativity |
Digital tools themselves are merely enablers, pushing the envelope of what learners can create. No longer is it acceptable for students to be passive consumers of content; they can contribute to the local and global knowledge ecosystem, learning through the act of producing and discussing rich media, applications, and objects. In the words of many institutional mission statements, students do not have to wait until they graduate to change the world.
Using readily available digital content creation tools (e.g., video production and editing, web and graphic tools), students are evolving into digital storytellers,
digital literacy now encompasses the important skills of being able to coordinate with others to create something truly original that neither mind would fathom independently.
The ability to discern credible from inaccurate resources is foundational to digital literacy. my note: #Fakenews
A lack of broad consensus on the meaning of digital literacy still hinders its uptake, although a growing body of research is helping higher education professionals better navigate the continuous adjustments to the field brought about by emerging pedagogies and technologies.
Information literacy is a nearly universal component within these digital literacy frameworks. Critically finding, assessing, and using digital content within the vast and sometimes chaotic internet appears as a vital skill in almost every account, including those published beyond libraries. In contrast, media literacy is less widely included in digital literacy publications, possibly due to a focus on scholarly, rather than popular, materials. Digital literacies ultimately combine information and media literacy.
United States digital literacy frameworks tend to focus on educational policy details and personal empowerment, the latter encouraging learners to become more effective students, better creators, smarter information consumers, and more influential members of their community.
National policies are vitally important in European digital literacy work, unsurprising for a continent well populated with nation-states and struggling to redefine itself… this recommendation for Balkan digital strategy: “Media and information education (with an emphasis on critical thinking and switching from consumption to action) should start at early ages, but address all ages.”
African digital literacy is more business-oriented. Frameworks often speak to job skills and digital entrepreneurship. New skills and professions are emphasized, symbolized by the call for “new collar” positions.
Middle Eastern nations offer yet another variation, with a strong focus on media literacy. As with other regions, this can be a response to countries with strong state influence or control over local media. It can also represent a drive to produce more locally-sourced content, as opposed to consuming
Digital literacy is a complex phenomenon in 2017, when considered internationally. Nations and regions are creating ways to help their populations grapple with the digital revolution that are shaped by their local situations. In doing so, they cut across the genealogy of digital literacies, touching on its historical components: information literacy, digital skills, and media literacy.
2017-nmc-strategic-brief-digital-literacy-in-higher-education-II-ycykt3 
How Does Digital Literacy Change Pedagogy?
Students are not all digital natives, and do not necessarily have the same level of capabilities. Some need to be taught to use online tools (such as how to navigate a LMS) for learning. However, once digital literacy skills for staff and students are explicitly recognized as important for learning and teaching, critical drivers for pedagogical change are in place.
Pedagogy that uses an inquiry based/problem solving approach is a great framework to enhance the use and practice of digital skills/capabilities in the classroom.
The current gap between students’ information literacy skills and their need to internalize digital literacy competencies creates an opportunity for academic librarians to support students in the pursuit of civic online reasoning at the core of NMC’s multimodal model of three digital literacies. Academic librarians need a new strategy that evolves information literacy to an expanded role educating digitally literate students. Let’s build a new model in which academic librarians are entrepreneurial collaborators with faculty,55 supporting their classroom efforts to help students become responsible sharers and commentators of news on social media.
“Digital literacy is not just about ensuring that students can use the latest technologies, but also developing skills to select the right tools for a particular context to deepen their learning outcomes and engage in creative problem-solving”
There is a disconnect between how students experience and interact with technology in their personal lives and how they use technology in their roles as students. Yes, students are digitally savvy, and yes, universities have a role in questioning (insightfully of course) their sometimes brash digital savviness. We have a situation where students are expecting more, but (as I see it) cannot provide a clear demand, while faculty are unable to walk in the shoes of the students.
+++++++++++++++++++
more on digital literacy in this IMS blog
https://blog.stcloudstate.edu/ims?s=digital+literacy
FERPA for Faculty
http://www.academicimpressions.com/webcast/ferpa-faculty
Join us for an online training program that will provide faculty with critical information about FERPA, the federal statute that governs nearly all student records. Beginning with an overview of the FERPA framework, we will address issues that faculty commonly face—often without realizing the implications and risks—including:
- Posting grades
- Emailing with, and about, students
- Writing recommendation letters
- Using online tools and collaborative pedagogies
- Speaking with (helicopter) parents
- Administrators requesting student information
If you are searching for relevant scenarios and practical tips for better understanding how FERPA applies to everyday work of faculty, this online training is right for you.
Bonus Training Material and Quiz
Included in registration is a bonus lesson covering specific nuances of FERPA as it relates to faculty and an accompanying quiz which will provide a chance for you and your team to test your knowledge immediately before or after the webcast. This 20-minute training will cover:
- Taking attendance, posting grades, and other course communication
- The Do’s and Don’ts of identifying students online, in person, and on paper
++++++++++++++++
more on FERPA in this IMS blog
https://blog.stcloudstate.edu/ims?s=ferpa
Teaching in the age of social media
Engaging with students – both inside and outside the classroom – who are continually linked in to social media and online devices presents a range of opportunities, challenges and pitfalls.
By DAVID SMITH | April 5, 2017
More and more of our public, private and professional lives are migrating online. There is little doubt that social media will infiltrate every aspect of our day-to-day existence. If used effectively, online tools are revolutionary for communicating and stimulating important conversations.
+++++++++++++++++++
more on use of technology in the classroom in this IMS blog
https://blog.stcloudstate.edu/ims/2017/04/03/use-of-laptops-in-the-classroom/
more on teaching with social media in this IMS blog
https://blog.stcloudstate.edu/ims?s=teach+social+media
two articles of interest regarding freedom of speech on the Internet


New heights in digital activism
As governments around the world impose new restrictions on internet freedom, it is worth remembering what is at stake. The present crackdown comes as digital platforms are being used in new and creative ways to advocate for change and, in many cases, save lives. Internet advocacy had real-world results in both democracies and authoritarian settings over the past year, and its impact was often most pronounced in countries where the information environment was more open online than off. In over two-thirds of the countries examined in this study, there was at least one significant example of individuals producing a tangible outcome by using online tools to fight for internet freedom, demand political accountability, advance women’s rights, support victims of unjust prosecution, or provide relief to those affected by natural disasters.
Fighting for internet freedom and digital rights
Social media were used effectively to fight for internet freedom in a variety of countries over the past year. In Thailand, over 150,000 people signed a Change.org petition against a government plan to centralize the country’s internet gateways, which would strengthen the authorities’ ability to monitor and censor online activity. As a result, the government announced that it had scrapped the plan, though skeptical internet users remain vigilant.
Using the hashtag #NoToSocialMediaBill, Nigerian digital rights organizations launched a multifaceted campaign to defeat a “Frivolous Petitions Prohibition Bill” that threatened to constrain speech on social media. Alongside significant digital media activism, civil society groups organized a march on the National Assembly, gathered signatures for a petition presented during a public hearing on the bill, and filed a lawsuit at the Federal High Court in Lagos, all of which contributed to the bill’s withdrawal in May 2016. India’s telecommunications regulator banned differential pricing schemes in February after more than a million comments were submitted online to protest companies that charge consumers different prices for select content or applications.
+++++++++++++++++++++
more on Internet freedom in this IMS blog:
https://blog.stcloudstate.edu/ims?s=freedom
https://blog.stcloudstate.edu/ims?s=civil
Save
International Journal of Mobile and Blended Learning (IJMBL)
Editor-in-Chief: David Parsons (The Mind Lab by Unitec, New Zealand)
Published Quarterly. Est. 2009.
ISSN: 1941-8647|EISSN: 1941-8655|DOI: 10.4018/IJMBL
Description
The International Journal of Mobile and Blended Learning (IJMBL) provides a forum for researchers in this field to share their knowledge and experience of combining e-learning and m-learning with other educational resources. Providing researchers, practitioners, and academicians with insight into a wide range of topics such as knowledge sharing, mobile games for learning, collaborative learning, and e-learning, this journal contains useful articles for those seeking to learn, analyze, improve, and apply technologies in mobile and blended learning. The journal spans theoretical, technical, and pedagogical issues in mobile and blended learning. These embrace comprehensive or critical reviews of the current literature, relevant technologies and applications, and important contextual issues such as privacy, security, adaptivity, and resource constraints.
Topics Covered
- Comprehensive or critical reviews of the current literature
- Evaluation of mobile or blended learning in practice
- Future of mobile or blended learning
- Knowledge Sharing
- Learner interaction/collaborative learning
- Mobile games for learning
- Mobile or blended learning applications
- Mobile or blended learning applied at different levels of education from pre-school to tertiary and beyond
- Pedagogical and/or philosophical underpinnings of mobile or blended learning
- Privacy and security issues
- Related research in learning, including e-learning and pedagogical approaches
- Resource constraints in the delivery of mobile or blended learning
- Reviews of the application of mobile or blended learning in multiple contexts
- Role of Wikis, blogs, podcasts, messaging, other online tools, and Web 2.0 components in learning delivery
- Roles of mobile, pervasive, and immersive technologies in education
- Technologies that directly or indirectly support mobile or blended learning systems (devices, networks, tools etc.)
- Theoretical approaches to mobile or blended learning solutions
- Use of mobile or blended learning in professional environments
Mission
The primary mission of the International Journal of Mobile and Blended Learning (IJMBL) is to provide comprehensive coverage and understanding of the role of innovative learning theory and practice in an increasingly mobile and pervasive technological environment. As technology enables a more seamless experience of device supported learning worlds that may integrate mobile, embedded, augmented, and immersive technologies, we may expect to see increasing interest and activity in blended approaches to learning. IJMBL brings together researchers at the forefront of this field, in both technology and pedagogical practice and assists them in the development and dissemination of new approaches to both mobile and blended learning.
+++++++++++++++++++++
More on mobile and blended learning in this IMS blog:
https://blog.stcloudstate.edu/ims?s=mobile+learning
https://blog.stcloudstate.edu/ims?s=blended+learning
Boulder Faculty Teaching with Technology Report
Sarah Wise, Education Researcher , Megan Meyer, Research Assistant, March 8,2016
http://www.colorado.edu/assett/sites/default/files/attached-files/final-fac-survey-full-report.pdf
Faculty perceive undergraduates to be less proficient with digital literacy skills. One-third think
their students do not find or organize digital information very well. The majority (52%) think
they lack skill in validating digital information.
My note: for the SCSU librarians, digital literacy is fancy word for information literacy. Digital literacy, as used in this report is much greater area, which encompasses much broader set of skills
Faculty do not prefer to teach online (57%) or in a hybrid format (where some sessions occur
online, 32%). One-third of faculty reported no experience with these least popular course types
my note: pay attention to the questions asked; questions I am asking Mike Penrod to let me work with faculty for years. Questions, which are snubbed by CETL and a dominance of D2L and MnSCU mandated tools is established.
Table 5. Do you use these in-class technologies for teaching undergraduates? Which are the Top 3 in-class technologies you would like to learn or use more? (n = 442)
|
Top 3 |
use in most of my classes |
have used in some classes |
tried, but do not use |
N/A: no experience |
| in-class activities, problems (via worksheets, tablets, laptops, simulations, beSocratic, etc.) |
52% |
33% |
30% |
6% |
30% |
| in-class question, discussion tools (e.g. Twitter, TodaysMeet, aka “backchannel communication”) |
47% |
8% |
13% |
11% |
68% |
| using online resources to find high quality curricular materials |
37% |
48% |
31% |
3% |
18% |
| iClickers |
24% |
23% |
16% |
9% |
52% |
| other presentation tool (Prezi, Google presentation, Slide Carnival, etc.) |
23% |
14% |
21% |
15% |
51% |
| whiteboard / blackboard |
20% |
58% |
23% |
6% |
14% |
| Powerpoint or Keynote |
20% |
74% |
16% |
4% |
5% |
| document camera / overhead projector |
15% |
28% |
20% |
14% |
38%
|
Table 6. Do you have undergraduates use these assignment technology tools? Which are your Top 3 assignment technology tools to learn about or use more? (n = 432)
|
Top 3 |
use in most of my classes |
have used in some classes |
tried, but do not use |
N/A: no experience using |
| collaborative reading and discussion tools (e.g. VoiceThread, NB, NotaBene, Highlighter, beSocratic) |
43% |
3% |
10% |
10% |
77% |
| collaborative project, writing, editing tools (wikis, PBWorks, Weebly, Google Drive, Dropbox, Zotero) |
38% |
16% |
29% |
12% |
43% |
| online practice problems / quizzes with instant feedback |
36% |
22% |
22% |
8% |
47% |
| online discussions (D2L, Today’s Meet, etc) |
31% |
33% |
21% |
15% |
30% |
| individual written assignment, presentation and project tools (blogs, assignment submission, Powerpoint, Prezi, Adobe Creative Suite, etc.) |
31% |
43% |
28% |
7% |
22% |
| research tools (Chinook, pubMed, Google Scholar, Mendeley, Zotero, Evernote) |
30% |
33% |
32% |
8% |
27% |
| online practice (problems, quizzes, simulations, games, CAPA, Pearson Mastering, etc.) |
27% |
20% |
21% |
7% |
52% |
| data analysis tools (SPSS, R, Latex, Excel, NVivo, MATLAB, etc.) |
24% |
9% |
23% |
6% |
62% |
| readings (online textbooks, articles, e-books) |
21% |
68% |
23% |
1% |
8% |
Table 7. Do you use any of these online tools in your teaching? Which are the Top 3 online tools you would like to learn about or use more? (n = 437)
|
Top 3 |
use in most of my classes |
have used in some classes |
tried, but do not use |
N/A: no experience using |
| videos/animations produced for my course (online lectures, Lecture Capture, Camtasia, Vimeo) |
38% |
14% |
21% |
11% |
54% |
| chat-based office hours or meetings (D2L chat, Google Hangouts, texting, tutoring portals, etc.) |
36% |
4% |
9% |
10% |
76% |
| simulations, PhET, educational games |
27% |
7% |
17% |
6% |
70% |
| videoconferencing-based office hours or meetings (Zoom, Skype, Continuing Education’s Composition hub, etc.) |
26% |
4% |
13% |
11% |
72% |
| alternative to D2L (moodle, Google Site, wordpress course website) |
23% |
11% |
10% |
13% |
66% |
| D2L course platform |
23% |
81% |
7% |
4% |
8% |
| online tutorials and trainings (OIT tutorials, Lynda.com videos) |
21% |
4% |
16% |
13% |
68% |
| D2L as a portal to other learning tools (homework websites, videos, simulations, Nota Bene/NB, Voice Thread, etc.) |
21% |
28% |
18% |
11% |
42% |
| videos/animations produced elsewhere |
19% |
40% |
36% |
2% |
22% |
In both large and small classes, the most common responses faculty make to digital distraction are to discuss why it is a problem and to limit or ban phones in class.
my note: which completely defies the BYOD and turns into empty talk / lip service.
Quite a number of other faculty (n = 18) reported putting the onus on themselves to plan engaging and busy class sessions to preclude distraction, for example:
“If my students are more interested in their laptops than my course material, I need to make my curriculum more interesting.”
I have not found this to be a problem. When the teaching and learning are both engaged/engaging, device problems tend to disappear.”
The most common complaint related to students and technology was their lack of common technological skills, including D2L and Google, and needing to take time to teach these skills in class (n = 14). Two commented that digital skills in today’s students were lower than in their students 10 years ago.
Table 9. Which of the following are the most effective types of learning opportunities about teaching, for you? Chose your Top 2-3. (n = 473)
Count Percentage
| meeting 1:1 with an expert |
296 |
63% |
| hour-long workshop |
240 |
51% |
| contact an expert on-call (phone, email, etc) |
155 |
33% |
| faculty learning community (meeting across asemester,
e.g. ASSETT’s Hybrid/Online Course Design Seminar) |
116 |
25% |
| expert hands-on support for course redesign (e.g. OIT’s Academic Design Team) |
114 |
24% |
| opportunity to apply for grant funding with expert support, for a project I design (e.g. ASSETT’s Development Awards) |
97 |
21% |
| half-day or day-long workshop |
98 |
21% |
| other |
40 |
8% |
| multi-day retreats / institutes |
30 |
6% |
Faculty indicated that the best times for them to attend teaching professional developments across the year are before and early semester, and summer. They were split among all options for meeting across one week, but preferred afternoon sessions to mornings. Only 8% of respondents (n = 40) indicated they would not likely attend any professional development session (Table 10).
+++++++++++++++++++++++++++
Teaching Through Technology
Table T1: Faculty beliefs about using digital technologies in teaching
|
Count |
Column N% |
| Technology is a significant barrier to teaching and learning. |
1 |
0.2% |
| Technology can have a place in teaching, but often detracts from teaching and learning. |
76 |
18.3% |
| Technology has a place in teaching, and usually enhances the teaching learning process. |
233 |
56.0% |
| Technology greatly enhances the teaching learning process. |
106 |
25.5% |
Table T2: Faculty beliefs about the impact of technology on courses
|
Count |
Column N% |
| Makes a more effective course |
302 |
72.6% |
| Makes no difference in the effectiveness of a course |
42 |
10.1% |
| Makes a less effective course |
7 |
1.7% |
| Has an unknown impact |
65 |
15.6% |
Table T3: Faculty use of common technologies (most frequently selected categories shaded)
|
Once a month or less |
A few hours a month |
A few hours a week |
An hour a day |
Several hours a day |
| Count |
% |
Count |
% |
Count |
% |
Count |
% |
Count |
% |
| Computer |
19 |
4.8% |
15 |
3.8% |
46 |
11.5% |
37 |
9.3% |
282 |
70.7% |
| Smart Phone |
220 |
60.6% |
42 |
11.6% |
32 |
8.8% |
45 |
12.4% |
24 |
6.6% |
| Office Software |
31 |
7.8% |
19 |
4.8% |
41 |
10.3% |
82 |
20.6% |
226 |
56.6% |
| Email |
1 |
0.2% |
19 |
4.6% |
53 |
12.8% |
98 |
23.7% |
243 |
58.7% |
| Social Networking |
243 |
68.8% |
40 |
11.3% |
40 |
11.3% |
23 |
6.5% |
7 |
2.0% |
| Video/Sound Media |
105 |
27.6% |
96 |
25.2% |
95 |
24.9% |
53 |
13.9% |
32 |
8.4% |
Table T9: One sample t-test for influence of technology on approaches to grading and assessment
|
Test Value = 50 |
| t |
df |
Sig. (2-tailed) |
Mean Difference |
95% Confidence Interval of the Difference |
| Lower |
Upper |
| In class tests and quizzes |
-4.369 |
78 |
.000 |
-9.74684 |
-14.1886 |
-5.3051 |
| Online tests and quizzes |
5.624 |
69 |
.000 |
14.77143 |
9.5313 |
20.0115 |
| Ungraded assessments |
1.176 |
66 |
.244 |
2.17910 |
-1.5208 |
5.8790 |
| Formative assessment |
5.534 |
70 |
.000 |
9.56338 |
6.1169 |
13.0099 |
| Short essays, papers, lab reports, etc. |
2.876 |
70 |
.005 |
5.45070 |
1.6702 |
9.2312 |
| Extended essays and major projects or performances |
1.931 |
69 |
.058 |
3.67143 |
-.1219 |
7.4648 |
| Collaborative learning projects |
.000 |
73 |
1.000 |
.00000 |
-4.9819 |
4.9819 |
Table T10: Rate the degree to which your role as a faculty member and teacher has changed as a result of increased as a result of increased use of technology
|
Strongly Disagree |
Disagree |
Somewhat Disagree |
Somewhat Agree |
Agree |
Strongly Agree |
| Count |
% |
Count |
% |
Count |
% |
Count |
% |
Count |
% |
Count |
% |
| shifting from the role of content expert to one of learning facilitator |
12 |
9.2% |
22 |
16.9% |
14 |
10.8% |
37 |
28.5% |
29 |
22.3% |
16 |
12.3% |
| your primary role is to provide content for students |
14 |
10.9% |
13 |
10.1% |
28 |
21.7% |
29 |
22.5% |
25 |
19.4% |
20 |
15.5% |
| your identification with your University is increased |
23 |
18.3% |
26 |
20.6% |
42 |
33.3% |
20 |
15.9% |
12 |
9.5% |
3 |
2.4% |
| you have less ownership of your course content |
26 |
20.2% |
39 |
30.2% |
24 |
18.6% |
21 |
16.3% |
14 |
10.9% |
5 |
3.9% |
| your role as a teacher is strengthened |
13 |
10.1% |
12 |
9.3% |
26 |
20.2% |
37 |
28.7% |
29 |
22.5% |
12 |
9.3% |
| your overall control over your course(s) is diminished |
23 |
17.7% |
44 |
33.8% |
30 |
23.1% |
20 |
15.4% |
7 |
5.4% |
6 |
4.6% |
Table T14: One sample t-test for influence of technology on faculty time spent on specific teaching activities
|
|
Test Value = 50 |
| t |
df |
Sig. (2-tailed) |
Mean Difference |
95% Confidence Interval of the Difference |
| Lower |
Upper |
| Lecturing |
-7.381 |
88 |
.000 |
-12.04494 |
-15.2879 |
-8.8020 |
| Preparing course materials |
9.246 |
96 |
.000 |
16.85567 |
13.2370 |
20.4744 |
| Identifying course materials |
8.111 |
85 |
.000 |
13.80233 |
10.4191 |
17.1856 |
| Grading / assessing |
5.221 |
87 |
.000 |
10.48864 |
6.4959 |
14.4813 |
| Course design |
12.962 |
94 |
.000 |
21.55789 |
18.2558 |
24.8600 |
| Increasing access to materials for all types of learners |
8.632 |
86 |
.000 |
16.12644 |
12.4126 |
19.8403 |
| Reading student discussion posts |
10.102 |
79 |
.000 |
21.98750 |
17.6553 |
26.3197 |
| Email to/with students |
15.809 |
93 |
.000 |
26.62766 |
23.2830 |
29.9724 |
++++++++++++++++++++++++++
Study of Faculty and Information Technology, 2014
http://net.educause.edu/ir/library/pdf/ers1407/ers1407.pdf
Although the LMS is pervasive in higher education, 15% of faculty said that they
do not use the LMS at all. Survey demographics suggest these nonusers are part of
the more mature faculty ranks, with a tenure status, more than 10 years of teaching
experience, and a full-professor standing.
18
The vast majority of faculty use the LMS
to conduct or support their teaching activities, but only three in five LMS users (60%)
said it is critical to their teaching. The ways in which faculty typically use the LMS are
presented in figure 8.
19
Pushing out information such as a syllabus or other handout
is the most common use of the LMS (58%), which is a basic functionality of the
first-generation systems that emerged in the late 1990s, and it remains one of the core
features of any LMS.
20
Many institutions preload the LMS with basic course content
(58%), up about 12% since 2011, and this base gives instructors a prepopulated plat
–
form from which to build their courses.
21
Preloading basic content does not appear to
preclude faculty from making the LMS part of their daily digital habit; a small majority
of faculty (56%) reported using the LMS daily, and another 37% use it weekly.
+++++++++++++++++++++++++++++
Digital Literacy, Engagement, and Digital Identity Development
https://www.insidehighered.com/blogs/student-affairs-and-technology/digital-literacy-engagement-and-digital-identity-development
+++++++++++++++++
++++++++++++++++
more on digital literacy in this IMS blog
https://blog.stcloudstate.edu/ims?s=digital+literacy
Save