Searching for "educause faculty"
Susan Grajek at Bryan Alexander on IT and education
Forum takes a deep dive into higher education and technology. On Thursday, March 23rd, from 2-3 pm EST we will be joined by Susan Grajek, the vice president for communities and research at EDUCAUSE
+++++++++++++++++++
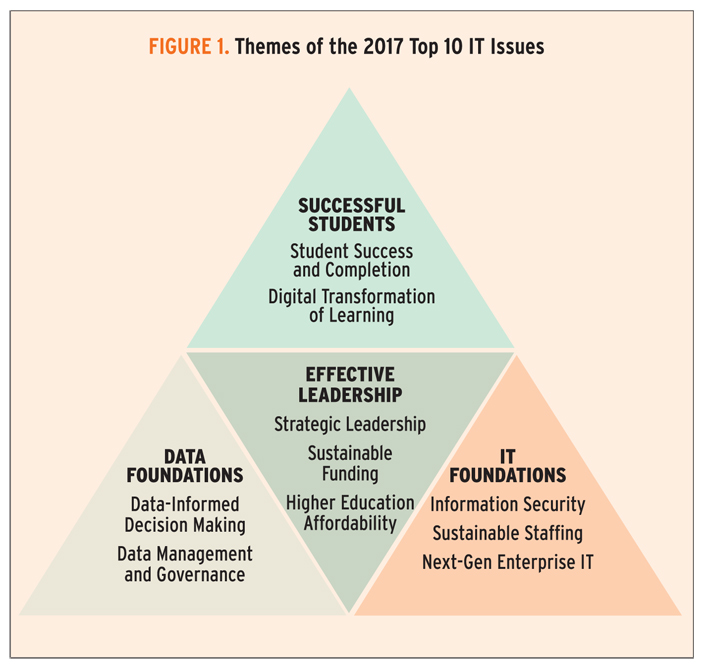
Top 10 IT Issues, 2017: Foundations for Student Success
- Susan Grajek and the 2016–2017 EDUCAUSE IT Issues Panel Tuesday, January 17, 2017http://er.educause.edu/articles/2017/1/top-10-it-issues-2017-foundations-for-student-successThe 2017 EDUCAUSE Top 10 IT Issues are all about student success
EDUCAUSE supports early adopters in this area through the Integrated Planning and Advising for Student Success (iPASS) grant challenge, a program in which EDUCAUSE helps develop models for the field by working closely with a small number of institutions that are pioneering iPASS systems.
Issue #1: Information Security
Developing a holistic, agile approach to reduce institutional exposure to information security threats
That program should encompass people, process, and technologies:
- Educate users
- Develop processes to identify and protect the most sensitive data
- Implement technologies to encrypt data and find and block advanced threats coming from outside the network via from any type of device
Who Outside the IT Department Should Care Most about This Issue?
- End-users, to understand how to avoid exposing their credentials
- Unit heads, to protect institutional data
- Senior leaders, to hold people accountable
- Institutional leadership, to endorse, fund, and advocate for good information security
Issue #2: Student Success and Completion
Effectively applying data and predictive analytics to improve student success and completion
Predictive analytics allows us to track trends, discover gaps and inefficiencies, and displace “best guess” scenarios based on implicitly developed stories about students.
Issue #3: Data-Informed Decision Making
Ensuring that business intelligence, reporting, and analytics are relevant, convenient, and used by administrators, faculty, and students
Higher education information systems generate vast amounts of data daily (including the classroom/LMS). This potentially rich source of information is underused. Even though most institutions have created reports, dashboards, and other distillations of data, these are not necessarily useful or used to inform strategic objectives such as student success or institutional efficiency.
Issue #4: Strategic Leadership
Repositioning or reinforcing the role of IT leadership as a strategic partner with institutional leadership
CIOs have two challenges in this regard. The first is getting to the table. Contemporary requirements for IT leaders position them well for strategic leadership.18 Those requirements include expertise in management and business practices, project portfolio management, negotiation, and change leadership. However, business-savvy CIOs can alienate some academics, particularly those opposed to administrators as leaders. Worse, not all CIOs are well-equipped for a position at the executive table.
Issue #5: Sustainable Funding
Developing IT funding models that sustain core services, support innovation, and facilitate growth
Two complications have deepened the IT funding challenge in recent years. The first is that information technology is now incontrovertibly core to the mission and function of colleges and universities. The second complication is that at most institutions, digital investments and technology refreshes have been funded with capital expenditures. Yet IT services and infrastructure are moving outside the institution, generally to the cloud, and cloud funding depends on ongoing expenditures rather than one-time investments.
Issue #6: Data Management and Governance
Improving the management of institutional data through data standards, integration, protection, and governance
Data management and governance is not an IT issue. It requires a broad, top-down approach because all departments need to buy in and agree. All stakeholders (data owners as well as IR, IT, and institutional leaders) must collaboratively develop a common set of data definitions and a common understanding of what data is needed, in what format, and for what purposes. This coordination, or governance, will enable constituents to communicate with confidence about the data (e.g., “the single version of truth”) and the standards (e.g., APLU, IPEDS, CDS) under which it is collected.
Institutions often choose to approach data management from three perspectives: (1) accuracy, (2) usability, and (3) privacy. The IT organization has a role to play in creating and maintaining data warehouses, integrating systems to facilitate data exchange, and maintaining standards for data privacy and security.
Issue #7: Higher Education Affordability
Prioritizing IT investments and resources in the context of increasing demand and limited resources
Uncoordinated, redundant expenditures supplant other needed investments, such as consistent classroom technology or dedicated information security staff. Planning needs to occur at the institutional or departmental level, but it also needs a place to coalesce and be assessed regionally, nationally, and in some cases, globally, because there isn’t enough money to do everything that institutional leaders, faculty, and others want or even need to do. Public systems are making some headway in sharing services, but for the most part, local optimization supersedes collaboration and compromise.
Issue #8: Sustainable Staffing
Ensuring adequate staffing capacity and staff retention as budgets shrink or remain flat and as external competition grows
As institutions become more dependent on their IT organizations, IT organizations are more dependent on the expertise and quality of their workforce. New hires need to be great hires, and great staff need to want to stay. Each new hire can change the culture and effectiveness of the IT organizations
Issue #9: Next-Gen Enterprise IT
Developing and implementing enterprise IT applications, architectures, and sourcing strategies to achieve agility, scalability, cost-effectiveness, and effective analytics
Buildings should outlive alumni; technology shouldn’t. IT leaders are examining core enterprise applications, including ERPs (traditionally, suites of financial, HR, and student information systems) and LMSs, for their ability to meet current and future needs.
Issue #10: Digital Transformation of Learning
Collaborating with faculty and academic leadership to apply technology to teaching and learning in ways that reflect innovations in pedagogy and the institutional mission
According to Michael Feldstein and Phil Hill, personalized learning applies technology to three processes: content (moving content delivery out of the classroom and allowing students to set their pace of learning); tutoring (allowing interactive feedback to both students and faculty); and contact time (enabling faculty to observe students’ work and coach them more).
+++++++++++++++++++++
more on IT in this IMS blog
https://blog.stcloudstate.edu/ims?s=information+technology
The Online Discussion group for Blended and Online Learning leads an interesting discussion on course evaluations; here are the highlights:
Perceptions-of-Online-Learning–Analysis-of-Online-Course-Evaluations-tbz6om
When we first started in 1999, we included ~10 questions in addition to our standard questions that were different for online courses. This information was particularly useful as we grew our online offerings (i.e. Would you take another online course. 93-5% answered yes consistently. How would you rate the level of interactivity between you and the instructor? Between you and the other students?) These were administered via SurveyMonkey because there were no online evaluation services back then.
Now we have a single evaluation that is administered to all students regardless of the delivery format (online, hybrid, blended, F2F or intensive) The questions were designed to be relevant regardless of the delivery format. All of these evaluations are administered online…which has its downsides (e.g. response rate is less especially compared to what was captured in F2F classes in the past.) We continue to explore ways to increase the response rate.
Reta Chaffee Director of Educational Technology-Academic Affairs Granite State College 25 Hall Street Concord, NH 03301 (603) 513-1350
+++++++++++++++++++++
On Behalf Of Krajewski, Scott
Sent: Friday, February 17, 2017 1:00 PM
To: BLEND-ONLINE@LISTSERV.EDUCAUSE.EDU
Subject: Re: [BLEND-ONLINE] Course Evaluations
Hi Hala, We have a standard online evaluation form for all courses. We do add 3 questions to the sports courses but otherwise we’re 100% standardized. We have a ton of info at
http://inside.augsburg.edu/ctl/resources/augsburg-resources-and-support/course-evaluations/
++++++++++++++++++++
You might find this study (or the related literature) helpful — http://patricklowenthal.com/publications/Student-Perceptions-of-Online-Learning–Analysis-of-Online-Course-Evaluations.pdf
Patrick Patrick R. Lowenthal | Associate Professor Educational Technology, Boise State University http://www.patricklowenthal.com
+++++++++++++++++++++++
On Behalf Of Rob Gibson
Sent: Friday, February 17, 2017 8:39 AM
To: BLEND-ONLINE@LISTSERV.EDUCAUSE.EDU
Subject: Re: [BLEND-ONLINE] Course Evaluations
We use the IDEA evaluation framework combined with CampusLabs as the delivery engine.
- IDEA is a well-established evaluation process dating back to the 1970s.
- The CampusLabs delivery process (new as of about 2 years ago) provides students with a single URL to complete their evaluations – on-campus or on-line. Mobile friendly.
- It uses the same base evaluation criteria across the university. (That’s how IDEA is able to substantiate reliability and validity.) IDEA is matched against a national database using a CIP code. Hence, faculty can gather comparative data of their course against other similar courses in the university, or at the national level.
- While each department uses the same basic framework, there are modification that can be made. For example, custom questions can be added to the eval (these fall outside the scope of the comparative data) and the learning objectives can be modified by course, department, school, college. We have one School that has custom learning objectives for each course in their program. Objectives are set using a 3 point Likert scale.
Very easy to set up a survey administration. Data is retrievable within 48 hours after close.
+++++++++++++
more on online learning in this IMS blog
https://blog.stcloudstate.edu/ims?s=online+education
From the The EDUCAUSE Blended and Online Learning Constituent Group Listserv <BLEND-ONLINE@LISTSERV.EDUCAUSE.EDU>
Can you recommend a peer-reviewed research article that addresses the learning outcomes/learning effectiveness of asynchronous vs. synchronous teaching approaches in online courses?
We have a program that has required weekly synchronous sessions (held via Bb Collaborate) that support the otherwise asynchronous courses in the program. The department is considering making that requirement optional to accommodate worldwide learners, but there are faculty who are concerned about the impact to the learning and transfer of knowledge to the students.
Any research that addresses the differences in these teaching modalities when it comes to learning outcomes?
Thanks in advance, Kristen Kristen Brown Assistant Director, Online Learning Delphi Center for Teaching and Learning
I am happy to share my own dissertation research which specifically focused on this topic as well. Please email me and I will share. andy.black@nurs.utah.edu
My note: I emailed Andy and will attach his dissertation to this blog, if interest
final-dissertation-andy-black-asynchronous-synchronous
On Behalf Of Henri Moser
Sent: Friday, January 06, 2017 8:35 AM
Here is a link to my dissertation which centered on synchronous academic support for online graduate students.Best,Henri
http://dune.une.edu/theses/56/
++++++++++++++++
more on synchronous online learning in this IMS blog
https://blog.stcloudstate.edu/ims?s=synchronous
Discussion on the EDUCAUSE Blended and Online Learning Group’s listserv
Question:
develop anonymous mid-course student evaluations allowing students to reflect on course and progress and informing instructor about what is working or not in the course.
Answers:
– what is working well for you in the course?
– what is not working well for you in the course?
krajewsk@AUGSBURG.EDU
++++++++++++++++++
- What is helping you learn?
- What is hindering your learning?
- What suggestions do you have to make the course better for you, your peers, or the instructor?
Katie Linder Research Director Extended Campus, Oregon State University 4943 The Valley Library Corvallis, Oregon 97331 Phone 541-737-4629 | Fax 541-737-2734 Email: kathryn.linder@oregonstate.edu
++++++++++++++++
At the University of Illinois, we have been using Informal Early Feedback as a way to gauge information from our students to help improve the courses before the end. Here are a couple of links to our site. The first is the main page on what IEF is and the second is the question bank we offer to faculty. This is a starting point for them, then we meet with those who want to work on tweaking them for their specific needs.
* About IEF: https://citl.illinois.edu/citl-101/measurement-evaluation/teaching-evaluation/ief
* Question Bank: https://citl.illinois.edu/citl-101/measurement-evaluation/teaching-evaluation/ief/ief-question-bank
If you have any questions at all, don’t hesitate to ask.
Sol Roberts-Lieb Associate Director, Center for Innovation in Teaching and Learning Pedagogy Strategy Team and Industry Liaison UNIVERSITY OF ILLINOIS AT URBANA-CHAMPAIGN
++++++++++++++++++
more on student evaluations in this IMS blog:
https://blog.stcloudstate.edu/ims?s=student+evaluation
Discussion on the EDUCAUSE Blended and Online Learning Group’s listserv
Question:\
I head an instructional design unit and we’ve been noticing that instructors with no experience in online teaching seem to struggle to teach in a blended environment. They get easily confused about 1) how to decide what content is best suited for in class and what goes online and 2) they also have difficulty bridging the two modalities to create a seamless and rich learning environment.
Rema Nilakanta, Ph.D., Director of Design and Delivery Engineering-LAS Online Learning 1328 Howe Hall 537 Bissell Rd P 515-294-9259 F 515-294-6184 W http://www.elo.iastate.edu
Answers:
Oregon State University has a hybrid course design program that is a partnership between OSU’s Ecampus and our Center for Teaching and Learning. You can find quite a few resources here: http://ctl.oregonstate.edu/hybrid-learning
Shannon Riggs Director, Course Development and Training Oregon State University Ecampus 4943 Valley Library Corvallis, OR 97331-4504 541.737.2613
+++++++++++++++++
http://onlinelearningconsortium.org/consult/olc-quality-scorecard-blended-learning-programs/
Jennifer Mathes, Ph.D. Director of Strategic Partnerships Online Learning Consortium Office: (781) 583-7571 Mobile: (913) 226-4977 Email: jennifer.mathes@onlinelearning-c.org Website: http://www.onlinelearning-c.org Skype: mathes.olc
+++++++++++++++
You might find my recent book The Blended Course Design Workbook: A Practical Guide to be a helpful resource. Each chapter has a literature review of the relevant research as well as activities to guide faculty through the various components of blended course design. You can read the first chapter on the fundamentals of blended teaching and learning at the publisher website. The book also has a companion website with additional resources here: http://www.bcdworkbook.com.
Katie Linder Research Director Extended Campus, Oregon State University 4943 The Valley Library Corvallis, Oregon 97331 Phone 541-737-4629 | Fax 541-737-2734 Email: kathryn.linder@oregonstate.edu Twitter: @ECResearchUnit & @RIA_podcast Check out the Research in Action podcast: ecampus.oregonstate.edu/podcast
+++++++++++
more on blended learning in this IMS blog:
https://blog.stcloudstate.edu/ims?s=blended+learning
NMC Releases Horizon Project Strategic Brief on Digital Literacy
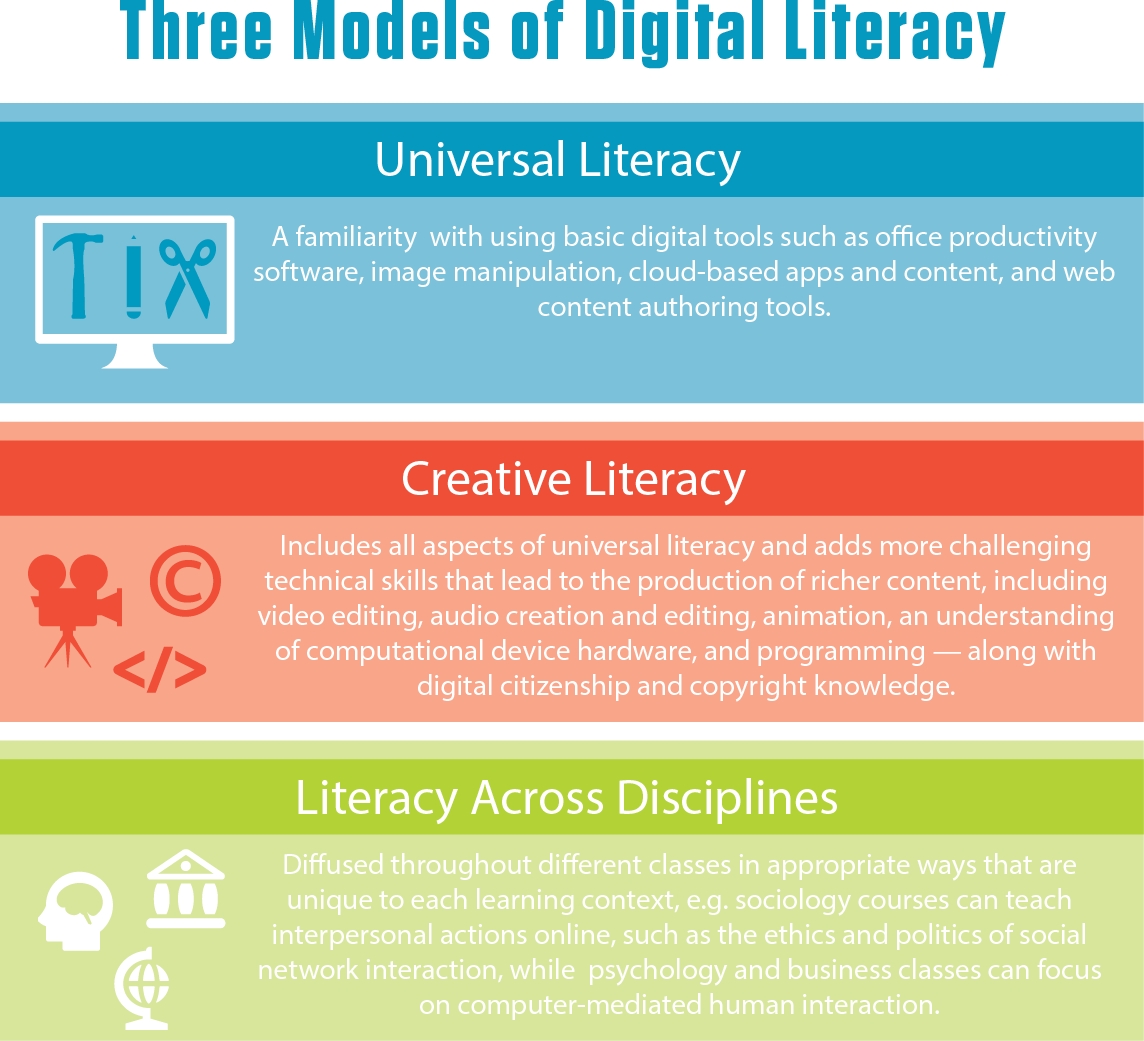
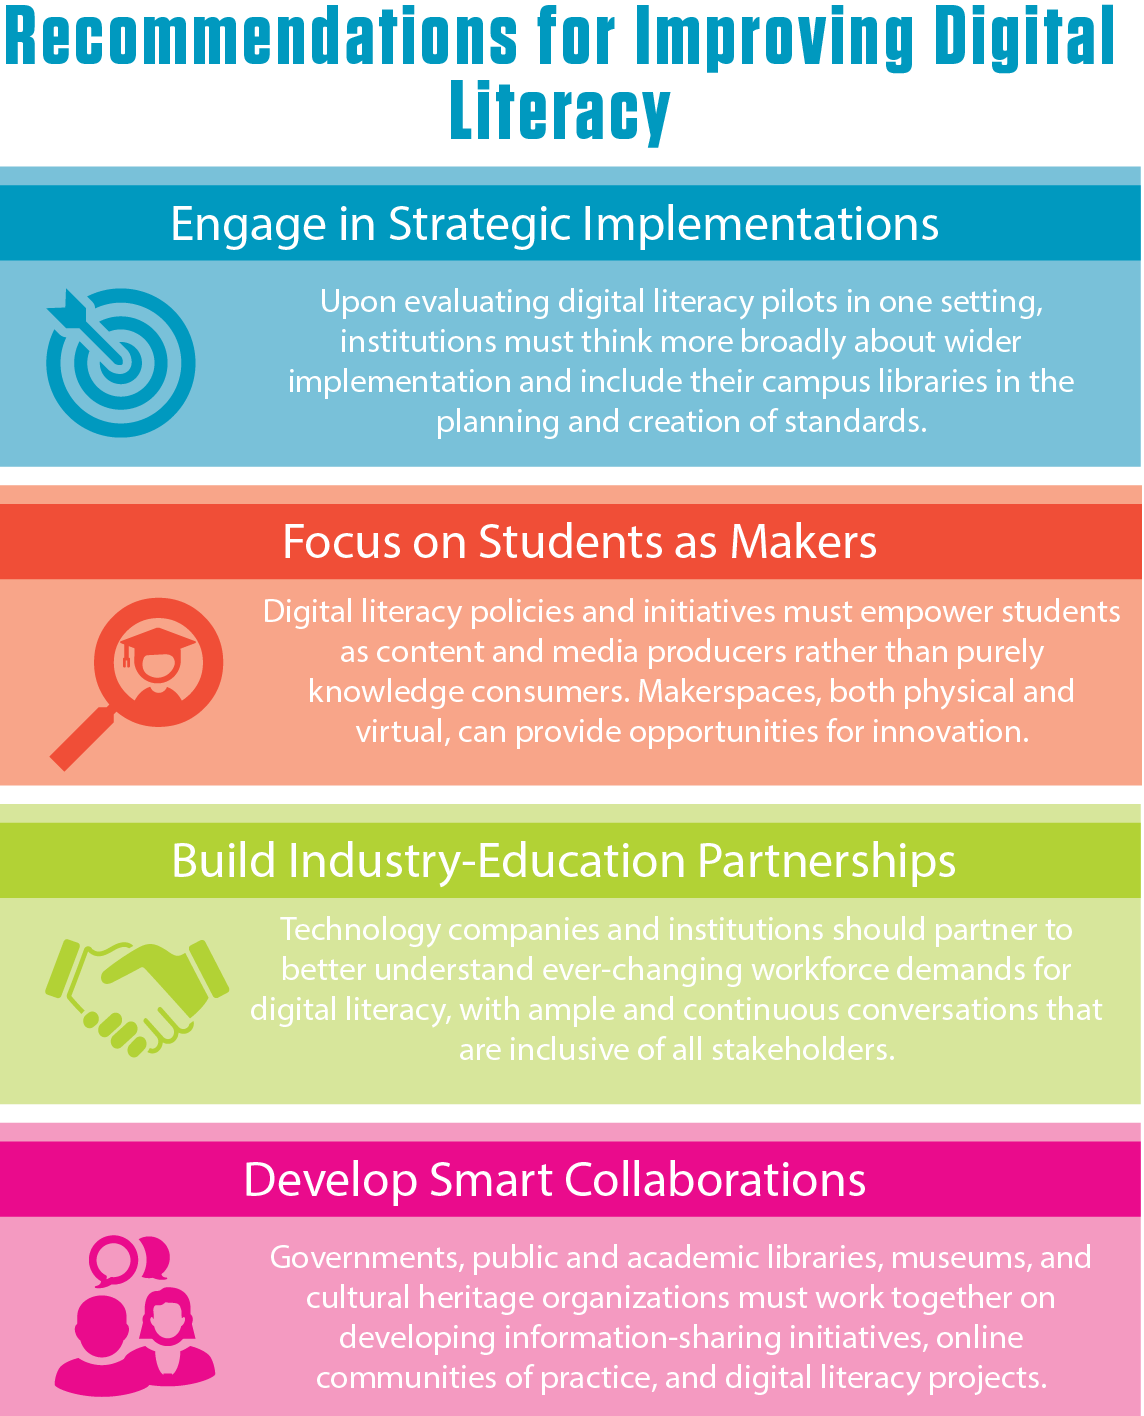
Anaheim, California (October 25, 2016) — The New Media Consortium (NMC) has released Digital Literacy: An NMC Horizon Project Strategic Brief in conjunction with the 2016 EDUCAUSE Annual Conference.
This project was launched because there is a lack of consensus across the field about how to define digital literacy and implement effective programs. A survey was disseminated throughout the NMC community of higher education leaders and practitioners to understand how digital literacy initiatives are impacting their campuses. The NMC’s research examines the current landscape to illuminate multiple models of digital literacy — universal literacy, creative literacy, and literacy across disciplines — around which dedicated programs can proliferate a spectrum of skills and competencies.
p. 8-10 examples across US universities on digital literacy organization
p. 12 Where does support for digital literacy come from your institution? Individual people

p. 13. campus libraries must be deeply embedded in course curriculum. While libraries have always supported academic institutions, librarians can play a more critical role in the development of digital literacy skills. Historically, these types of programs have been implemented in “one-off” segments, which are experienced apart from a student’s normal studies and often delivered in a one-size-fits-all method. However, an increasing number of academic libraries are supporting a more integrated approach that delivers continuous skill development and assessment over time to both students and faculty. This requires deeper involvement with departments and agreeing on common definitions of what capacities should be achieved, and the most effective pedagogical method. Librarians are tasked with broadening their role in the co-design of curriculum and improving their instruction techniques to work alongside faculty toward the common goal of training students to be savvy digital researchers. University of Arizona Libraries, for example, found that a key step in this transition required collaborating on a common instructional philosophy.
 +++++++++++++++
more on digital literacy in this IMS blog:
https://blog.stcloudstate.edu/ims?s=digital+literacy
Save
Boulder Faculty Teaching with Technology Report
Sarah Wise, Education Researcher , Megan Meyer, Research Assistant, March 8,2016
http://www.colorado.edu/assett/sites/default/files/attached-files/final-fac-survey-full-report.pdf
Faculty perceive undergraduates to be less proficient with digital literacy skills. One-third think
their students do not find or organize digital information very well. The majority (52%) think
they lack skill in validating digital information.
My note: for the SCSU librarians, digital literacy is fancy word for information literacy. Digital literacy, as used in this report is much greater area, which encompasses much broader set of skills
Faculty do not prefer to teach online (57%) or in a hybrid format (where some sessions occur
online, 32%). One-third of faculty reported no experience with these least popular course types
my note: pay attention to the questions asked; questions I am asking Mike Penrod to let me work with faculty for years. Questions, which are snubbed by CETL and a dominance of D2L and MnSCU mandated tools is established.
Table 5. Do you use these in-class technologies for teaching undergraduates? Which are the Top 3 in-class technologies you would like to learn or use more? (n = 442)
|
Top 3 |
use in most of my classes |
have used in some classes |
tried, but do not use |
N/A: no experience |
| in-class activities, problems (via worksheets, tablets, laptops, simulations, beSocratic, etc.) |
52% |
33% |
30% |
6% |
30% |
| in-class question, discussion tools (e.g. Twitter, TodaysMeet, aka “backchannel communication”) |
47% |
8% |
13% |
11% |
68% |
| using online resources to find high quality curricular materials |
37% |
48% |
31% |
3% |
18% |
| iClickers |
24% |
23% |
16% |
9% |
52% |
| other presentation tool (Prezi, Google presentation, Slide Carnival, etc.) |
23% |
14% |
21% |
15% |
51% |
| whiteboard / blackboard |
20% |
58% |
23% |
6% |
14% |
| Powerpoint or Keynote |
20% |
74% |
16% |
4% |
5% |
| document camera / overhead projector |
15% |
28% |
20% |
14% |
38%
|
Table 6. Do you have undergraduates use these assignment technology tools? Which are your Top 3 assignment technology tools to learn about or use more? (n = 432)
|
Top 3 |
use in most of my classes |
have used in some classes |
tried, but do not use |
N/A: no experience using |
| collaborative reading and discussion tools (e.g. VoiceThread, NB, NotaBene, Highlighter, beSocratic) |
43% |
3% |
10% |
10% |
77% |
| collaborative project, writing, editing tools (wikis, PBWorks, Weebly, Google Drive, Dropbox, Zotero) |
38% |
16% |
29% |
12% |
43% |
| online practice problems / quizzes with instant feedback |
36% |
22% |
22% |
8% |
47% |
| online discussions (D2L, Today’s Meet, etc) |
31% |
33% |
21% |
15% |
30% |
| individual written assignment, presentation and project tools (blogs, assignment submission, Powerpoint, Prezi, Adobe Creative Suite, etc.) |
31% |
43% |
28% |
7% |
22% |
| research tools (Chinook, pubMed, Google Scholar, Mendeley, Zotero, Evernote) |
30% |
33% |
32% |
8% |
27% |
| online practice (problems, quizzes, simulations, games, CAPA, Pearson Mastering, etc.) |
27% |
20% |
21% |
7% |
52% |
| data analysis tools (SPSS, R, Latex, Excel, NVivo, MATLAB, etc.) |
24% |
9% |
23% |
6% |
62% |
| readings (online textbooks, articles, e-books) |
21% |
68% |
23% |
1% |
8% |
Table 7. Do you use any of these online tools in your teaching? Which are the Top 3 online tools you would like to learn about or use more? (n = 437)
|
Top 3 |
use in most of my classes |
have used in some classes |
tried, but do not use |
N/A: no experience using |
| videos/animations produced for my course (online lectures, Lecture Capture, Camtasia, Vimeo) |
38% |
14% |
21% |
11% |
54% |
| chat-based office hours or meetings (D2L chat, Google Hangouts, texting, tutoring portals, etc.) |
36% |
4% |
9% |
10% |
76% |
| simulations, PhET, educational games |
27% |
7% |
17% |
6% |
70% |
| videoconferencing-based office hours or meetings (Zoom, Skype, Continuing Education’s Composition hub, etc.) |
26% |
4% |
13% |
11% |
72% |
| alternative to D2L (moodle, Google Site, wordpress course website) |
23% |
11% |
10% |
13% |
66% |
| D2L course platform |
23% |
81% |
7% |
4% |
8% |
| online tutorials and trainings (OIT tutorials, Lynda.com videos) |
21% |
4% |
16% |
13% |
68% |
| D2L as a portal to other learning tools (homework websites, videos, simulations, Nota Bene/NB, Voice Thread, etc.) |
21% |
28% |
18% |
11% |
42% |
| videos/animations produced elsewhere |
19% |
40% |
36% |
2% |
22% |
In both large and small classes, the most common responses faculty make to digital distraction are to discuss why it is a problem and to limit or ban phones in class.
my note: which completely defies the BYOD and turns into empty talk / lip service.
Quite a number of other faculty (n = 18) reported putting the onus on themselves to plan engaging and busy class sessions to preclude distraction, for example:
“If my students are more interested in their laptops than my course material, I need to make my curriculum more interesting.”
I have not found this to be a problem. When the teaching and learning are both engaged/engaging, device problems tend to disappear.”
The most common complaint related to students and technology was their lack of common technological skills, including D2L and Google, and needing to take time to teach these skills in class (n = 14). Two commented that digital skills in today’s students were lower than in their students 10 years ago.
Table 9. Which of the following are the most effective types of learning opportunities about teaching, for you? Chose your Top 2-3. (n = 473)
Count Percentage
| meeting 1:1 with an expert |
296 |
63% |
| hour-long workshop |
240 |
51% |
| contact an expert on-call (phone, email, etc) |
155 |
33% |
| faculty learning community (meeting across asemester,
e.g. ASSETT’s Hybrid/Online Course Design Seminar) |
116 |
25% |
| expert hands-on support for course redesign (e.g. OIT’s Academic Design Team) |
114 |
24% |
| opportunity to apply for grant funding with expert support, for a project I design (e.g. ASSETT’s Development Awards) |
97 |
21% |
| half-day or day-long workshop |
98 |
21% |
| other |
40 |
8% |
| multi-day retreats / institutes |
30 |
6% |
Faculty indicated that the best times for them to attend teaching professional developments across the year are before and early semester, and summer. They were split among all options for meeting across one week, but preferred afternoon sessions to mornings. Only 8% of respondents (n = 40) indicated they would not likely attend any professional development session (Table 10).
+++++++++++++++++++++++++++
Teaching Through Technology
Table T1: Faculty beliefs about using digital technologies in teaching
|
Count |
Column N% |
| Technology is a significant barrier to teaching and learning. |
1 |
0.2% |
| Technology can have a place in teaching, but often detracts from teaching and learning. |
76 |
18.3% |
| Technology has a place in teaching, and usually enhances the teaching learning process. |
233 |
56.0% |
| Technology greatly enhances the teaching learning process. |
106 |
25.5% |
Table T2: Faculty beliefs about the impact of technology on courses
|
Count |
Column N% |
| Makes a more effective course |
302 |
72.6% |
| Makes no difference in the effectiveness of a course |
42 |
10.1% |
| Makes a less effective course |
7 |
1.7% |
| Has an unknown impact |
65 |
15.6% |
Table T3: Faculty use of common technologies (most frequently selected categories shaded)
|
Once a month or less |
A few hours a month |
A few hours a week |
An hour a day |
Several hours a day |
| Count |
% |
Count |
% |
Count |
% |
Count |
% |
Count |
% |
| Computer |
19 |
4.8% |
15 |
3.8% |
46 |
11.5% |
37 |
9.3% |
282 |
70.7% |
| Smart Phone |
220 |
60.6% |
42 |
11.6% |
32 |
8.8% |
45 |
12.4% |
24 |
6.6% |
| Office Software |
31 |
7.8% |
19 |
4.8% |
41 |
10.3% |
82 |
20.6% |
226 |
56.6% |
| Email |
1 |
0.2% |
19 |
4.6% |
53 |
12.8% |
98 |
23.7% |
243 |
58.7% |
| Social Networking |
243 |
68.8% |
40 |
11.3% |
40 |
11.3% |
23 |
6.5% |
7 |
2.0% |
| Video/Sound Media |
105 |
27.6% |
96 |
25.2% |
95 |
24.9% |
53 |
13.9% |
32 |
8.4% |
Table T9: One sample t-test for influence of technology on approaches to grading and assessment
|
Test Value = 50 |
| t |
df |
Sig. (2-tailed) |
Mean Difference |
95% Confidence Interval of the Difference |
| Lower |
Upper |
| In class tests and quizzes |
-4.369 |
78 |
.000 |
-9.74684 |
-14.1886 |
-5.3051 |
| Online tests and quizzes |
5.624 |
69 |
.000 |
14.77143 |
9.5313 |
20.0115 |
| Ungraded assessments |
1.176 |
66 |
.244 |
2.17910 |
-1.5208 |
5.8790 |
| Formative assessment |
5.534 |
70 |
.000 |
9.56338 |
6.1169 |
13.0099 |
| Short essays, papers, lab reports, etc. |
2.876 |
70 |
.005 |
5.45070 |
1.6702 |
9.2312 |
| Extended essays and major projects or performances |
1.931 |
69 |
.058 |
3.67143 |
-.1219 |
7.4648 |
| Collaborative learning projects |
.000 |
73 |
1.000 |
.00000 |
-4.9819 |
4.9819 |
Table T10: Rate the degree to which your role as a faculty member and teacher has changed as a result of increased as a result of increased use of technology
|
Strongly Disagree |
Disagree |
Somewhat Disagree |
Somewhat Agree |
Agree |
Strongly Agree |
| Count |
% |
Count |
% |
Count |
% |
Count |
% |
Count |
% |
Count |
% |
| shifting from the role of content expert to one of learning facilitator |
12 |
9.2% |
22 |
16.9% |
14 |
10.8% |
37 |
28.5% |
29 |
22.3% |
16 |
12.3% |
| your primary role is to provide content for students |
14 |
10.9% |
13 |
10.1% |
28 |
21.7% |
29 |
22.5% |
25 |
19.4% |
20 |
15.5% |
| your identification with your University is increased |
23 |
18.3% |
26 |
20.6% |
42 |
33.3% |
20 |
15.9% |
12 |
9.5% |
3 |
2.4% |
| you have less ownership of your course content |
26 |
20.2% |
39 |
30.2% |
24 |
18.6% |
21 |
16.3% |
14 |
10.9% |
5 |
3.9% |
| your role as a teacher is strengthened |
13 |
10.1% |
12 |
9.3% |
26 |
20.2% |
37 |
28.7% |
29 |
22.5% |
12 |
9.3% |
| your overall control over your course(s) is diminished |
23 |
17.7% |
44 |
33.8% |
30 |
23.1% |
20 |
15.4% |
7 |
5.4% |
6 |
4.6% |
Table T14: One sample t-test for influence of technology on faculty time spent on specific teaching activities
|
|
Test Value = 50 |
| t |
df |
Sig. (2-tailed) |
Mean Difference |
95% Confidence Interval of the Difference |
| Lower |
Upper |
| Lecturing |
-7.381 |
88 |
.000 |
-12.04494 |
-15.2879 |
-8.8020 |
| Preparing course materials |
9.246 |
96 |
.000 |
16.85567 |
13.2370 |
20.4744 |
| Identifying course materials |
8.111 |
85 |
.000 |
13.80233 |
10.4191 |
17.1856 |
| Grading / assessing |
5.221 |
87 |
.000 |
10.48864 |
6.4959 |
14.4813 |
| Course design |
12.962 |
94 |
.000 |
21.55789 |
18.2558 |
24.8600 |
| Increasing access to materials for all types of learners |
8.632 |
86 |
.000 |
16.12644 |
12.4126 |
19.8403 |
| Reading student discussion posts |
10.102 |
79 |
.000 |
21.98750 |
17.6553 |
26.3197 |
| Email to/with students |
15.809 |
93 |
.000 |
26.62766 |
23.2830 |
29.9724 |
++++++++++++++++++++++++++
Study of Faculty and Information Technology, 2014
http://net.educause.edu/ir/library/pdf/ers1407/ers1407.pdf
Although the LMS is pervasive in higher education, 15% of faculty said that they
do not use the LMS at all. Survey demographics suggest these nonusers are part of
the more mature faculty ranks, with a tenure status, more than 10 years of teaching
experience, and a full-professor standing.
18
The vast majority of faculty use the LMS
to conduct or support their teaching activities, but only three in five LMS users (60%)
said it is critical to their teaching. The ways in which faculty typically use the LMS are
presented in figure 8.
19
Pushing out information such as a syllabus or other handout
is the most common use of the LMS (58%), which is a basic functionality of the
first-generation systems that emerged in the late 1990s, and it remains one of the core
features of any LMS.
20
Many institutions preload the LMS with basic course content
(58%), up about 12% since 2011, and this base gives instructors a prepopulated plat
–
form from which to build their courses.
21
Preloading basic content does not appear to
preclude faculty from making the LMS part of their daily digital habit; a small majority
of faculty (56%) reported using the LMS daily, and another 37% use it weekly.
+++++++++++++++++++++++++++++
Digital Literacy, Engagement, and Digital Identity Development
https://www.insidehighered.com/blogs/student-affairs-and-technology/digital-literacy-engagement-and-digital-identity-development
+++++++++++++++++
++++++++++++++++
more on digital literacy in this IMS blog
https://blog.stcloudstate.edu/ims?s=digital+literacy
Save
This year we’d like to involve a wider segment of the teaching and learning community to help us design the survey. Please join us online for one of two 30-minute discussion sessions:
Sept 14 at 12pm ET OR Sept 15 at 2pm ET
To join, just go to https://educause.acms.com/eliweb on the date and time of the session and join as a guest. No registration or login needed.
———————————————————————————-
Key Issues in Teaching and Learning 2016
http://www.educause.edu/eli/initiatives/key-issues-in-teaching-and-learning

1. Academic Transformation
3. Assessment of Learning
4. Online and Blended Learning
5. Learning Analytics
6. Learning Space Design
8. Open Educational Resources & Content
9. Working with Emerging Technology
10. Next Gen Digital Learning Environments (NGDLE) & Services
11. Digital & Informational Literacies
12. Adaptive Learning
13. Mobile Learning
14. Evaluating Tech-Based Instructional Innovations
15. Evolution of the Profession
2015 Student and Faculty Technology Research Studies
https://library.educause.edu/resources/2015/8/2015-student-and-faculty-technology-research-studies
Report: https://library.educause.edu/~/media/files/library/2015/8/ers1510ss.pdf?la=en
Infographic: ECAR_2015
++++++++++++++++++
Study of Students and Information Technology, 2014
https://library.educause.edu/resources/2014/10/2014-student-and-faculty-technology-research-studies
report: https://library.educause.edu/~/media/files/library/2014/10/ers1406.pdf
Infographic: ECAR_2014
++++++++++++++++
Higher Ed: EDUCAUSE Releases ECAR Study of Undergraduate Students and Information Technology 2013
Gary Price
Direct to Full Text Report (49 pages; PDF)
++++++++++++++++++++++++++
ECAR 2011

|
|
| Student’s relationship with technology is complex. They recognize its value but still need guidance when it comes to better using it for academics. |
Educause’s ECAR Study, 2013 |
InforMedia Services
|
IMS faculty would be happy to meet with you or your group at your convenience.
Please request using this Google Form: http://scsu.mn/1OjBMf9 or
by email: pmiltenoff@stcloudstate.edu | informedia@stcloudstate.edu
Here is the evaluation form: http://bit.ly/imseval |
How you can reach us:
Services we provide:
- Instruct and collaborate with faculty, staff and students on specific computer, Cloud and mobile applications
- Assist faculty in course design and instruction to incorporate SCSU’s resources
- Join faculty in the classroom instructional design to assist students with learning technology application for the class
- Consult with faculty on instructional design issues, particularly those that use the World Wide Web, multimedia techniques and interactivity
- Collaborate with faculty, staff and students on technology-related projects
- Work with campus units in technology planning and acquisition
- Respond to faculty, staff and students requests and technology developments
|

     |
Desire2Learn (D2L), Digital literacy, digital photography, e-learning, educational technology, gamification, gaming, image editing, interactive apps, learning, lecture capture, Millennials, mobile apps, mobile apps, mobile devices, mobile learning, MOOC, online learning, Photoshop, podcasting, programming languages, smartboard, social media, teaching, technology, technology literacy, video editing, virtualization, web conferencing platform, web development, web editingAdobe Connect, Coding, customer satisfaction, e-learning, education, feedback, IMS, online learning, satisfaction survey, technology, technology instruction, workshops
Save
Save
Save
Save